
Page 96 - QEB_2_2016_lowres
P. 96
The sectors which lost employment during the first quarter of 2016 in the Western Cape
were: Manufacturing (38 000), Construction (12 000), Transport (4 000) and Trade (3 000).
However, on a year–on–year comparison, for the labour market performance of 2015Q1
and 2016Q1, the Western Cape Province created 92 000 jobs.
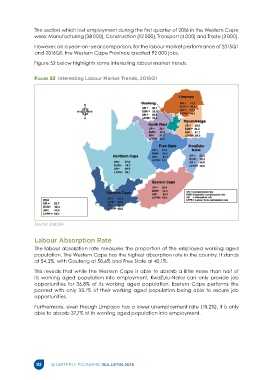
Figure 52 below highlights some interesting labour market trends.
Figure 52 Interesting Labour Market Trends, 2016Q1
Source: StatsSA
Labour Absorption Rate
The labour absorption rate measures the proportion of the employed working aged
population. The Western Cape has the highest absorption rate in the country. It stands
at 54,3%, with Gauteng at 50,6% and Free State at 42,1%.
This reveals that while the Western Cape is able to absorb a little more than half of
its working aged population into employment, KwaZulu-Natal can only provide job
opportunities for 36,8% of its working aged population. Eastern Cape performs the
poorest with only 33,1% of their working aged population being able to secure job
opportunities.
Furthermore, even though Limpopo has a lower unemployment rate (18,2%), it is only
able to absorb 37,7% of its working aged population into employment.
92 QUARTERLY ECONOMIC BULLETIN 2016