Page 94 - QEB_2_2016_lowres
P. 94

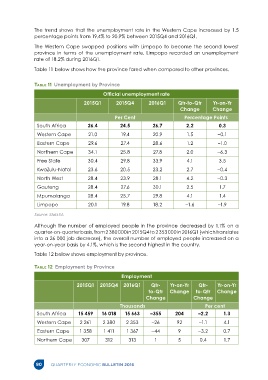
The trend shows that the unemployment rate in the Western Cape increased by 1.5
                percentage points from 19.4% to 20.9% between 2015Q4 and 2016Q1.

                The Western Cape swapped positions with Limpopo to become the second lowest
                province in terms of the unemployment rate. Limpopo recorded an unemployment
                rate of 18.2% during 2016Q1.
                Table 11 below shows how the province fared when compared to other provinces.


                Table 11  Unemployment by Province
                                               Official unemployment rate

                                      2015Q1         2015Q4        2016Q1       Qtr-to-Qtr      Yr-on-Yr
                                                                                 Change        Change

                                                    Per Cent                       Percentage Points
                 South Africa           26.4          24.5           26.7           2.2           0.3
                 Western Cape           21.0           19.4          20.9           1.5           –0.1

                 Eastern Cape           29.6           27.4          28.6           1.2           –1.0
                 Northern Cape          34.1          25.8           27.8           2.0           –6.3

                 Free State             30.4           29.8          33.9           4.1           3.5
                 KwaZulu-Natal          23.6          20.5           23.2           2.7           –0.4
                 North West             28.4           23.9          28.1           4.2           –0.3

                 Gauteng                28.4           27.6          30.1           2.5           1.7
                 Mpumalanga             28.4          25.7           29.8           4.1           1.4

                 Limpopo                20.1           19.8          18.2          –1.6           –1.9

                Source: StatsSA

                Although the number of employed people in the province decreased by 1.1% on a
                quarter-on-quarter basis, from 2 380 000 in 2015Q4 to 2 353 000 in 2016Q1 (which translates
                into a 26 000 job decrease), the overall number of employed people increased on a
                year-on-year basis by 4.1%, which is the second highest in the country.

                Table 12 below shows employment by province.

                Table 12  Employment by Province

                                                       Employment
                                   2015Q1    2015Q4     2016Q1      Qtr-     Yr-on-Yr    Qtr-     Yr-on-Yr
                                                                   to-Qtr   Change      to-Qtr   Change
                                                                  Change               Change
                                                      Thousands                             Per cent
                 South Africa       15 459    16 018    15 663      –355       204       –2.2       1.3
                 Western Cape       2 261      2 380     2 353      –26         92       –1.1       4.1

                 Eastern Cape       1 358      1 411     1 367      –44         9        –3.2       0.7
                 Northern Cape       307        312       313         1         5         0.4       1.7


                 90     QUARTERLY ECONOMIC BULLETIN 2016
   89   90   91   92   93   94   95   96   97   98   99