
Page 95 - QEB_2_2016_lowres
P. 95
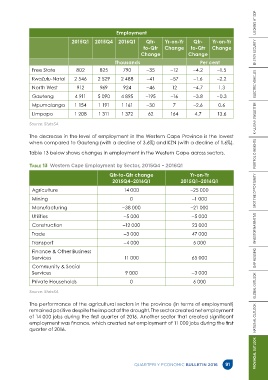
Employment

                                 2015Q1    2015Q4     2016Q1      Qtr-    Yr-on-Yr     Qtr-    Yr-on-Yr
                                                                 to-Qtr   Change      to-Qtr   Change
                                                                Change               Change
                                                    Thousands                             Per cent
               Free State          802       825        790       –35        –12       –4.2       –1.5

               KwaZulu-Natal      2 546     2 529      2 488      –41        –57       –1.6      –2.2
               North West          912       969        924       –46        12        –4.7       1.3

               Gauteng            4 911     5 090      4 895      –195       –16       –3.8      –0.3
               Mpumalanga         1 154      1 191     1 161      –30         7        –2.6       0.6

               Limpopo            1 208      1 311     1 372       62        164       4.7       13.6

              Source: StatsSA

              The decrease in the level of employment in the Western Cape Province is the lowest
              when compared to Gauteng (with a decline of 3.6%) and KZN (with a decline of 1.6%).

              Table 13 below shows changes in employment in the Western Cape across sectors.

              Table 13  Western Cape Employment by Sector, 2015Q4 – 2016Q1

                                                  Qtr-to-Qtr change                  Yr-on-Yr
                                                   2015Q4–2016Q1                 2015Q1–2016Q1

               Agriculture                              14 000                        –25 000                      PROVINCIAL OUTLOOK      NATIONAL OUTLOOK      GLOBAL OUTLOOK      GAP HOUSING      INVESTOR NARRATIVE      SPOT THE OPPORTUNITY      PORTFOLIO INSIGHTS      KHULISA NEWSLETTER      ELECTRIC VEHICLES      ENERGY SECURITY      LOOKING AT GDP
               Mining                                      0                          –1 000

               Manufacturing                           –38 000                        –21 000
               Utilities                                –5 000                        –5 000

               Construction                             –12 000                       23 000
               Trade                                    –3 000                        47 000
               Transport                                –4 000                         5 000

               Finance & Other Business
               Services                                 11 000                        65 000

               Community & Social
               Services                                  9 000                        –3 000
               Private Households                          0                           6 000

              Source: StatsSA

              The performance of the agricultural sectors in the province (in terms of employment)
              remained positive despite the impact of the drought. The sector created net employment
              of 14 000 jobs during the first quarter of 2016. Another sector that created significant
              employment was finance, which created net employment of 11 000 jobs during the first
              quarter of 2016.


                                                             QUARTERLY ECONOMIC BULLETIN 2016        91