
Page 92 - QEB_2_2016_lowres
P. 92
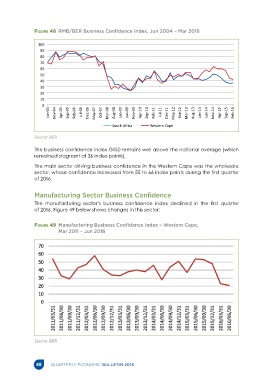
Figure 48  RMB/BER Business Confidence Index, Jun 2004 – Mar 2016


                  100
                   90
                   80
                   70
                   60
                   50
                   40
                   30
                   20
                   10
                    0
                       Jun-04  Nov-04  Apr-05  Sep-05  Feb-06  Jul-06  Dec-06  May-07  Oct-07  Mar-08  Aug-08  Jan-09  Jun-09  Nov-09  Apr-10  Sep-10  Feb-11  Jul-11  Dec-11  May-12  Oct-12  Mar-13  Aug-13  Jan-14  Jun-14  Nov-14  Apr-15  Sep-15  Feb-16


                                                   South Africa            Western Cape

                Source: BER


                The business confidence index G150 remains well above the national average (which
                remained stagnant at 36 index points).

                The main sector driving business confidence in the Western Cape was the wholesale
                sector, whose confidence increased from 55 to 66 index points during the first quarter
                of 2016.


                Manufacturing Sector Business Confidence

                The  manufacturing  sector’s  business  confidence  index  declined  in  the  first  quarter
                of 2016. Figure 49 below shows changes in this sector:


                Figure 49   Manufacturing Business Confidence Index – Western Cape,
                           Mar 2011 – Jun 2016


                Source: BER


                 88     QUARTERLY ECONOMIC BULLETIN 2016