
Page 1 - Bay_County_Townhouses_and_Condos_2017-Q2_Detail_Neat
P. 1
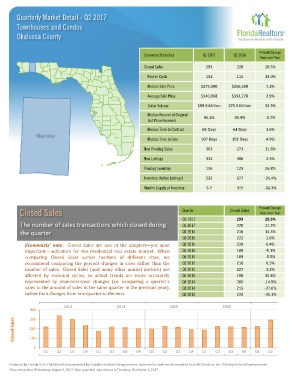
Quarterly Market Detail - Q2 2017
        Townhouses and Condos

        Okaloosa County


                                                                                                             Percent Change
                                                             Summary Statistics       Q2 2017      Q2 2016
                                                                                                              Year-over-Year
                                                             Closed Sales              293          228         28.5%

                                                               Paid in Cash            131          115         13.9%
                                                               Median Sale Price     $275,000     $256,500      7.2%

                                                               Average Sale Price    $340,968     $331,278      2.9%
                                                               Dollar Volume        $99.9 Million  $75.5 Million  32.3%

                                                               Median Percent of Original
                                                                                      95.2%        95.9%        -0.7%
                                                               List Price Received
                                                               Median Time to Contract  65 Days   64 Days       1.6%

                                                               Median Time to Sale   107 Days     102 Days      4.9%
                                                             New Pending Sales         303          271         11.8%

                                                             New Listings              313          306         2.3%

                                                             Pending Inventory         156          123         26.8%
                                                             Inventory (Active Listings)  532       677        -21.4%
                                                             Months Supply of Inventory  6.7        9.9        -32.3%


                                                                                                             Percent Change
         Closed Sales                                                        Quarter             Closed Sales  Year-over-Year
                                                                             Q2 2017                293         28.5%
         The number of sales transactions which closed during                Q1 2017                228         21.3%
         the quarter                                                         Q4 2016                216         14.3%
                                                                             Q3 2016                222         2.8%
            Economists' note : Closed Sales are one of the simplest—yet most  Q2 2016               228         0.4%
            important—indicators for the residential real estate market. When  Q1 2016              188         -5.1%
            comparing Closed Sales across markets of different sizes, we     Q4 2015                189         -5.5%
            recommend comparing the percent changes in sales rather than the  Q3 2015               216         0.5%
            number of sales. Closed Sales (and many other market metrics) are  Q2 2015              227         3.2%
            affected by seasonal cycles, so actual trends are more accurately  Q1 2015              198         15.8%
            represented by year-over-year changes (i.e. comparing a quarter's  Q4 2014              200        -14.9%
            sales to the amount of sales in the same quarter in the previous year),  Q3 2014        215        -27.6%
            rather than changes from one quarter to the next.                Q2 2014                220        -35.1%

                            2013                  2014                  2015                  2016
              400

       Closed Sales  200
              300


              100
               0
                   Q1    Q2   Q3    Q4   Q1    Q2   Q3    Q4   Q1    Q2   Q3    Q4    Q1   Q2    Q3   Q4    Q1   Q2

     Produced by Florida REALTORS® with data provided by Florida's multiple listing services. Statistics for each month compiled from MLS feeds on the 15th day of the following month.
     Data released on Wednesday, August 9, 2017. Next quarterly data release is Thursday, November 2, 2017.