
Page 7 - Bay_County_Townhouses_and_Condos_2017-Q2_Detail_Neat
P. 7
Quarterly Market Detail - Q2 2017
Townhouses and Condos
Okaloosa County
Percent Change
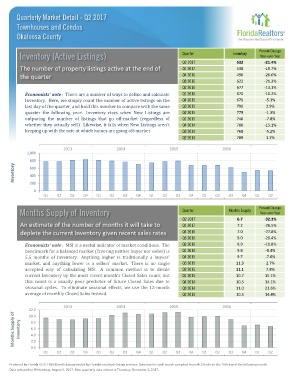
Inventory (Active Listings) Quarter Inventory Year-over-Year
Q2 2017 532 -21.4%
The number of property listings active at the end of Q1 2017 538 -19.7%
the quarter Q4 2016 496 -26.0%
Q3 2016 622 -21.3%
Q2 2016 677 -13.1%
Economists' note : There are a number of ways to define and calculate Q1 2016 670 -10.2%
Inventory. Here, we simply count the number of active listings on the Q4 2015 670 -5.1%
last day of the quarter, and hold this number to compare with the same Q3 2015 790 2.9%
quarter the following year. Inventory rises when New Listings are Q2 2015 779 -1.3%
outpacing the number of listings that go off-market (regardless of Q1 2015 746 -7.8%
whether they actually sell). Likewise, it falls when New Listings aren't Q4 2014 706 -15.1%
keeping up with the rate at which homes are going off-market. Q3 2014 768 -5.2%
Q2 2014 789 1.2%
2013 2014 2015 2016
1,000
800
Inventory 600
400
200
0
Q1 Q2 Q3 Q4 Q1 Q2 Q3 Q4 Q1 Q2 Q3 Q4 Q1 Q2 Q3 Q4 Q1 Q2
Percent Change
Months Supply of Inventory Quarter Months Supply Year-over-Year
Q2 2017 6.7 -32.3%
An estimate of the number of months it will take to Q1 2017 7.2 -26.5%
deplete the current Inventory given recent sales rates Q4 2016 7.0 -27.8%
Q3 2016 9.0 -20.4%
Economists' note : MSI is a useful indicator of market conditions. The Q2 2016 9.9 -10.8%
benchmark for a balanced market (favoring neither buyer nor seller) is Q1 2016 9.8 -8.4%
5.5 months of inventory. Anything higher is traditionally a buyers' Q4 2015 9.7 -7.6%
market, and anything lower is a sellers' market. There is no single Q3 2015 11.3 2.7%
accepted way of calculating MSI. A common method is to divide Q2 2015 11.1 7.8%
current Inventory by the most recent month's Closed Sales count, but Q1 2015 10.7 15.1%
this count is a usually poor predictor of future Closed Sales due to Q4 2014 10.5 14.1%
seasonal cycles. To eliminate seasonal effects, we use the 12-month Q3 2014 11.0 23.6%
average of monthly Closed Sales instead. Q2 2014 10.3 14.4%
2013 2014 2015 2016
12.0
Months Supply of Inventory 8.0
10.0
6.0
4.0
2.0
0.0
Q1 Q2 Q3 Q4 Q1 Q2 Q3 Q4 Q1 Q2 Q3 Q4 Q1 Q2 Q3 Q4 Q1 Q2
Produced by Florida REALTORS® with data provided by Florida's multiple listing services. Statistics for each month compiled from MLS feeds on the 15th day of the following month.
Data released on Wednesday, August 9, 2017. Next quarterly data release is Thursday, November 2, 2017.