
Page 8 - Bay_County_Townhouses_and_Condos_2017-Q2_Detail_Neat
P. 8
Quarterly Market Detail - Q2 2017
Townhouses and Condos
Okaloosa County
Percent Change
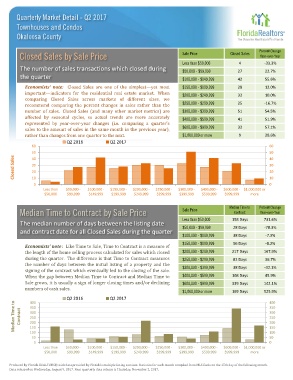
Closed Sales by Sale Price Sale Price Closed Sales Year-over-Year
Less than $50,000 4 -33.3%
The number of sales transactions which closed during
$50,000 - $99,999 27 22.7%
the quarter
$100,000 - $149,999 42 55.6%
Economists' note: Closed Sales are one of the simplest—yet most $150,000 - $199,999 28 12.0%
important—indicators for the residential real estate market. When 33 10.0%
comparing Closed Sales across markets of different sizes, we $200,000 - $249,999
recommend comparing the percent changes in sales rather than the $250,000 - $299,999 25 -16.7%
number of sales. Closed Sales (and many other market metrics) are $300,000 - $399,999 51 54.5%
affected by seasonal cycles, so actual trends are more accurately $400,000 - $599,999 41 51.9%
represented by year-over-year changes (i.e. comparing a quarter's
sales to the amount of sales in the same month in the previous year), $600,000 - $999,999 33 57.1%
rather than changes from one quarter to the next. $1,000,000 or more 9 28.6%
Q2 2016 Q2 2017
60 60
50 50
Closed Sales 30 30
40
40
20
20
10
0 10
0
Less than $50,000 - $100,000 - $150,000 - $200,000 - $250,000 - $300,000 - $400,000 - $600,000 - $1,000,000 or
$50,000 $99,999 $149,999 $199,999 $249,999 $299,999 $399,999 $599,999 $999,999 more
Median Time to Percent Change
Median Time to Contract by Sale Price Sale Price Contract Year-over-Year
Less than $50,000 158 Days 731.6%
The median number of days between the listing date
$50,000 - $99,999 28 Days -78.3%
and contract date for all Closed Sales during the quarter
$100,000 - $149,999 38 Days -7.3%
Economists' note : Like Time to Sale, Time to Contract is a measure of $150,000 - $199,999 56 Days -8.2%
the length of the home selling process calculated for sales which closed $200,000 - $249,999 217 Days 167.9%
during the quarter. The difference is that Time to Contract measures $250,000 - $299,999 82 Days 36.7%
the number of days between the initial listing of a property and the
signing of the contract which eventually led to the closing of the sale. $300,000 - $399,999 38 Days -32.1%
When the gap between Median Time to Contract and Median Time to $400,000 - $599,999 108 Days 45.9%
Sale grows, it is usually a sign of longer closing times and/or declining $600,000 - $999,999 339 Days 142.1%
numbers of cash sales.
$1,000,000 or more 169 Days 525.9%
Q2 2016 Q2 2017 400
Median Time to Contract 350 350
400
300
300
250
250
200
200
150
100
100
50
50 150
0 0
Less than $50,000 - $100,000 - $150,000 - $200,000 - $250,000 - $300,000 - $400,000 - $600,000 - $1,000,000 or
$50,000 $99,999 $149,999 $199,999 $249,999 $299,999 $399,999 $599,999 $999,999 more
Produced by Florida REALTORS® with data provided by Florida's multiple listing services. Statistics for each month compiled from MLS feeds on the 15th day of the following month.
Data released on Wednesday, August 9, 2017. Next quarterly data release is Thursday, November 2, 2017.