
Page 5 - Bay_County_Townhouses_and_Condos_2017-Q2_Detail_Neat
P. 5
Quarterly Market Detail - Q2 2017
Townhouses and Condos
Okaloosa County
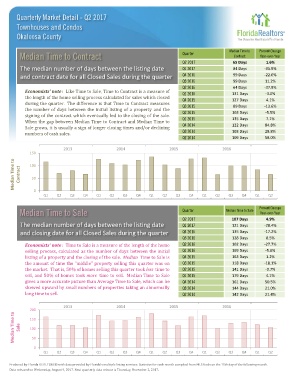
Median Time to Percent Change
Median Time to Contract Quarter Contract Year-over-Year
Q2 2017 65 Days 1.6%
The median number of days between the listing date Q1 2017 84 Days -35.9%
and contract date for all Closed Sales during the quarter Q4 2016 99 Days -22.0%
Q3 2016 99 Days 11.2%
Q2 2016 64 Days -37.9%
Economists' note : Like Time to Sale, Time to Contract is a measure of Q1 2016 131 Days -3.0%
the length of the home selling process calculated for sales which closed
during the quarter. The difference is that Time to Contract measures Q4 2015 127 Days 4.1%
the number of days between the initial listing of a property and the Q3 2015 89 Days -13.6%
signing of the contract which eventually led to the closing of the sale. Q2 2015 103 Days -5.5%
When the gap between Median Time to Contract and Median Time to Q1 2015 135 Days 7.1%
Sale grows, it is usually a sign of longer closing times and/or declining Q4 2014 122 Days 84.8%
numbers of cash sales. Q3 2014 103 Days 28.8%
Q2 2014 109 Days 58.0%
2013 2014 2015 2016
150
Median Time to Contract 100
50
0
Q1 Q2 Q3 Q4 Q1 Q2 Q3 Q4 Q1 Q2 Q3 Q4 Q1 Q2 Q3 Q4 Q1 Q2
Percent Change
Median Time to Sale Quarter Median Time to Sale Year-over-Year
Q2 2017 107 Days 4.9%
The median number of days between the listing date Q1 2017 121 Days -28.4%
and closing date for all Closed Sales during the quarter Q4 2016 135 Days -17.2%
Q3 2016 128 Days 8.5%
Economists' note : Time to Sale is a measure of the length of the home Q2 2016 102 Days -27.7%
selling process, calculated as the number of days between the initial Q1 2016 169 Days -5.6%
listing of a property and the closing of the sale. Median Time to Sale is Q4 2015 163 Days 1.2%
the amount of time the "middle" property selling this quarter was on Q3 2015 118 Days -18.1%
the market. That is, 50% of homes selling this quarter took less time to Q2 2015 141 Days -0.7%
sell, and 50% of homes took more time to sell. Median Time to Sale Q1 2015 179 Days 4.1%
gives a more accurate picture than Average Time to Sale, which can be Q4 2014 161 Days 50.5%
skewed upward by small numbers of properties taking an abnormally Q3 2014 144 Days 21.0%
long time to sell. Q2 2014 142 Days 21.4%
2013 2014 2015 2016
200
Median Time to Sale 150
100
50
0
Q1 Q2 Q3 Q4 Q1 Q2 Q3 Q4 Q1 Q2 Q3 Q4 Q1 Q2 Q3 Q4 Q1 Q2
Produced by Florida REALTORS® with data provided by Florida's multiple listing services. Statistics for each month compiled from MLS feeds on the 15th day of the following month.
Data released on Wednesday, August 9, 2017. Next quarterly data release is Thursday, November 2, 2017.