
Page 6 - Bay_County_Townhouses_and_Condos_2017-Q2_Detail_Neat
P. 6
Quarterly Market Detail - Q2 2017
Townhouses and Condos
Okaloosa County
Percent Change
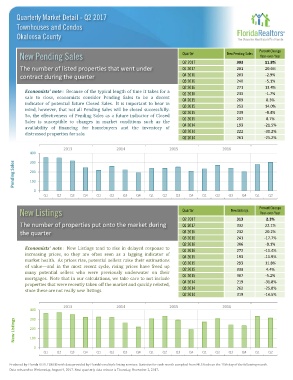
New Pending Sales
New Pending Sales Quarter Year-over-Year
Q2 2017 303 11.8%
The number of listed properties that went under Q1 2017 281 20.6%
contract during the quarter Q4 2016 203 -2.9%
Q3 2016 240 -5.1%
Q2 2016 271 13.4%
Economists' note : Because of the typical length of time it takes for a Q1 2016 233 -1.7%
sale to close, economists consider Pending Sales to be a decent
indicator of potential future Closed Sales. It is important to bear in Q4 2015 209 8.3%
mind, however, that not all Pending Sales will be closed successfully. Q3 2015 253 14.0%
So, the effectiveness of Pending Sales as a future indicator of Closed Q2 2015 239 -8.4%
Sales is susceptible to changes in market conditions such as the Q1 2015 237 8.7%
availability of financing for homebuyers and the inventory of Q4 2014 193 -21.5%
distressed properties for sale. Q3 2014 222 -30.2%
Q2 2014 261 -25.2%
2013 2014 2015 2016
400
Pending Sales 200
300
100
0
Q1 Q2 Q3 Q4 Q1 Q2 Q3 Q4 Q1 Q2 Q3 Q4 Q1 Q2 Q3 Q4 Q1 Q2
Percent Change
New Listings Quarter New Listings Year-over-Year
Q2 2017 313 2.3%
The number of properties put onto the market during Q1 2017 332 22.1%
the quarter Q4 2016 232 20.2%
Q3 2016 241 -17.7%
Q2 2016 306 -8.1%
Economists' note : New Listings tend to rise in delayed response to Q1 2016 272 -11.4%
increasing prices, so they are often seen as a lagging indicator of
market health. As prices rise, potential sellers raise their estimations Q4 2015 193 -11.9%
of value—and in the most recent cycle, rising prices have freed up Q3 2015 293 11.8%
many potential sellers who were previously underwater on their Q2 2015 333 4.4%
mortgages. Note that in our calculations, we take care to not include Q1 2015 307 -5.2%
properties that were recently taken off the market and quickly relisted, Q4 2014 219 -31.8%
since these are not really new listings. Q3 2014 262 -25.8%
Q2 2014 319 -14.5%
2013 2014 2015 2016
400
New Listings 200
300
100
0
Q1 Q2 Q3 Q4 Q1 Q2 Q3 Q4 Q1 Q2 Q3 Q4 Q1 Q2 Q3 Q4 Q1 Q2
Produced by Florida REALTORS® with data provided by Florida's multiple listing services. Statistics for each month compiled from MLS feeds on the 15th day of the following month.
Data released on Wednesday, August 9, 2017. Next quarterly data release is Thursday, November 2, 2017.