Page 9 - Bay_County_Townhouses_and_Condos_2017-Q2_Detail_Neat
P. 9

Quarterly Market Detail - Q2 2017
        Townhouses and Condos

        Okaloosa County


                                                                                                             Percent Change
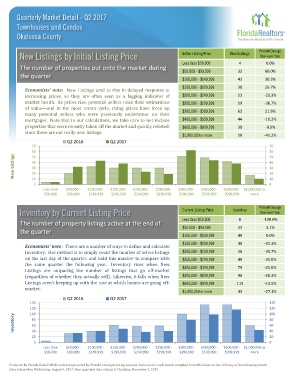
         New Listings by Initial Listing Price                               Initial Listing Price  New Listings  Year-over-Year
                                                                             Less than $50,000       4          0.0%
         The number of properties put onto the market during
                                                                             $50,000 - $99,999      32          60.0%
         the quarter
                                                                             $100,000 - $149,999    43          30.3%

            Economists' note: New Listings tend to rise in delayed response to  $150,000 - $199,999  38         26.7%
            increasing prices, so they are often seen as a lagging indicator of  $200,000 - $249,999  23       -23.3%
            market health. As prices rise, potential sellers raise their estimations  $250,000 - $299,999  19  -36.7%
            of value—and in the most recent cycle, rising prices have freed up
            many potential sellers who were previously underwater on their   $300,000 - $399,999    62          21.6%
            mortgages. Note that in our calculations, we take care to not include  $400,000 - $599,999  44     -10.2%
            properties that were recently taken off the market and quickly relisted,  $600,000 - $999,999  38   -9.5%
            since these are not really new  listings.
                                                                             $1,000,000 or more     10         -41.2%
                             Q2 2016           Q2 2017
              70                                                                                                  70
              60                                                                                                  60
       New Listings  40                                                                                           40
              50
                                                                                                                  50
              30
                                                                                                                  30
              20
                                                                                                                  20
              10
                                                                                                                  0
               0                                                                                                  10
                   Less than  $50,000 -  $100,000 -  $150,000 -  $200,000 -  $250,000 -  $300,000 -  $400,000 -  $600,000 - $1,000,000 or
                    $50,000  $99,999  $149,999  $199,999  $249,999  $299,999  $399,999  $599,999  $999,999  more

                                                                                                             Percent Change
         Inventory by Current Listing Price                                  Current Listing Price  Inventory  Year-over-Year
                                                                             Less than $50,000       0         -100.0%
         The number of property listings active at the end of
                                                                             $50,000 - $99,999      33          3.1%
         the quarter
                                                                             $100,000 - $149,999    40          0.0%
            Economists' note : There are a number of ways to define and calculate  $150,000 - $199,999  48     -21.3%
            Inventory. Our method is to simply count the number of active listings  $200,000 - $249,999  36    -35.7%
            on the last day of the quarter, and hold this number to compare with  $250,000 - $299,999  40      -31.0%
            the same quarter the following year. Inventory rises when New
            Listings are outpacing the number of listings that go off-market  $300,000 - $399,999   79         -21.0%
            (regardless of whether they actually sell). Likewise, it falls when New  $400,000 - $599,999  98   -26.3%
            Listings aren't keeping up with the rate at which homes are going off-  $600,000 - $999,999  115   -13.5%
            market.
                                                                             $1,000,000 or more     43         -27.1%
                             Q2 2016           Q2 2017
              140                                                                                                 140
              120                                                                                                 120
                                                                                                                  100
              100
       Inventory  80                                                                                              80
              60
                                                                                                                  60
              40
              20                                                                                                  40
                                                                                                                  20
               0                                                                                                  0
                   Less than  $50,000 -  $100,000 -  $150,000 -  $200,000 -  $250,000 -  $300,000 -  $400,000 -  $600,000 - $1,000,000 or
                    $50,000  $99,999  $149,999  $199,999  $249,999  $299,999  $399,999  $599,999  $999,999  more

     Produced by Florida REALTORS® with data provided by Florida's multiple listing services. Statistics for each month compiled from MLS feeds on the 15th day of the following month.
     Data released on Wednesday, August 9, 2017. Next quarterly data release is Thursday, November 2, 2017.
   4   5   6   7   8   9   10