
Page 5 - Carrier Recombination Activity and Structural Properties of Small-Angle Grain Boundaries in Multicrystalline Silicon
P. 5
Jpn. J. Appl. Phys., Vol. 46, No. 10A (2007) J. CHEN and T. SEKIGUCHI
tilt angle of around 3–3.5 (not shown here). For the same
(a) tilt angle, the boundary of a general SA is much smoother
than that of the special SA. Although both SAs showed a
Special
band of horizontal stripes, the band appearing at the special
SA fluctuates and is more discontinuous.
3.1.3 Discussion on clean SA-GBs
First, the energy levels of SA-GBs are discussed on the
General basis of the EBIC results at 300 and 100 K. According to
Shockley–Read–Hall (SRH) statistics, 28) the shallow level
exhibits a strong temperature dependence in recombination
activity, which is due to the change in the occupation
fraction of the shallow level caused by the Fermi level shift.
However, for the deep level, there is no significant temper-
ature dependence, since the deep level is far from the Fermi
level. Thus, the temperature dependence of EBIC contrast
(b)
gives a rough indication of the position of the energy level.
Shallow-level defects showed weak contrast at room
temperature and strong contrast at low temperature, while
the deep-level defects showed strong contrast even at room
temperature. According to the above discussion, SA-GBs
with weak EBIC contrast at 300 K are associated with
shallow levels, while those with strong EBIC contrast are
accompanied with deep or mixed levels. Note that the EBIC
contrasts of SA-GBs at 100 K were about 5–10 times larger
than those of LA-GBs, which made it very easy to
distinguish between SA- and LA-GBs. The strong EBIC
contrast of SA-GBs at 100 K suggests that the SA-GBs
possess a high density of shallow recombination centers,
which probably originates from the dislocation arrays at the
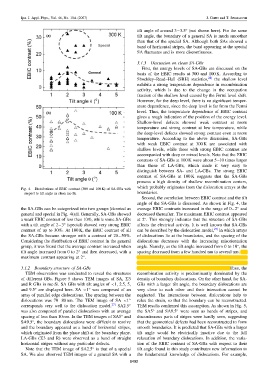
Fig. 4. Distributions of EBIC contrast (300 and 100 K) of SA-GBs with
respect to tilt angle in clean mc-Si. boundaries.
Second, the correlation between EBIC contrast and the tilt
angle of the SA-GBs is discussed. As shown in Fig. 4, the
the SA-GBs can be categorized into two groups [denoted as average EBIC contrasts increased in the range of 0–2 and
general and special in Fig. 4(a)]. Generally, SA-GBs showed decreased thereafter. The maximum EBIC contrast appeared
a weak EBIC contrast of less than 10%, while some SA-GBs at 2 . This strongly indicates that the structure of SA-GBs
with a tilt angle of 2–3 (special) showed very strong EBIC affects the electrical activity. It is well known that SA-GBs
contrast of up to 30%. At 100 K, the EBIC contrast of all can be described by the dislocation model, 27) in which arrays
the SA-GBs became stronger with a contrast of 20–50%. of dislocations lie at the boundaries, and the spacing of the
Considering the distribution of EBIC contrast in the general dislocations decreases with the increasing misorientation
group, it was found that the average contrast increased when angle. Namely, as the tilt angle increased from 0 to 10 , the
tilt angle increased from 0 to 2 and then decreased, with a spacing decreased from a few hundred nm to several nm. For
maximum contrast appearing at 2 . the SA-GBs with a smaller tilt angle (0–1 ), the spacing
between boundary dislocations is large and the interaction
3.1.2 Boundary structure of SA-GBs between boundary dislocations can be neglected. Thus, the
TEM observation was conducted to reveal the structures recombination activity is predominantly dominated by the
of different GBs. Figure 5 shows TEM images of SA, 3 density of boundary dislocations. On the other hand, for SA-
and R GBs in mc-Si. SA GBs with tilt angles of <1, 2.5, 5, GBs with a larger tilt angle, the boundary dislocations are
and 9.5 are displayed here. SA <1 was composed of an very close to each other and their interaction cannot be
array of parallel edge dislocations. The spacing between the neglected. The interactions between dislocations help to
dislocations was 70–80 nm. The TEM image of SA <1 relax the strain, so that the boundary can be reconstructed.
corresponds very well to the dislocation model. 27) SA2.5 TEM results confirmed this assumption. As shown in Fig. 5,
was also composed of parallel dislocations with an average the SA5 and SA9.5 were seen as bands of stripes, and
spacing of less than 10 nm. In the TEM images of SA5 and discontinuous parts of stripes were hardly seen, suggesting
SA9.5 , the boundary dislocations were difficult to resolve that the geometrical defects had been reconstructed to form
and the boundary appeared as a band of horizontal stripes, smooth boundaries. It is predicted that SA-GBs with a larger
which originated from the phase shift at the boundary plane. tilt angle would be electrically inactive due to the full
LA-GBs (3 and R) were observed as a band of straight relaxation of boundary dislocations. In addition, the varia-
horizontal stripes without any particular defects. tion of the EBIC contrast of SA-GBs with respect to their
Note that the TEM image of SA2.5 is that of a special tilt angle found in this study contributes new information to
SA. We also observed TEM images of a general SA with a the fundamental knowledge of dislocations. For example,
6492