
Page 46 - RFHL ANNUAL REPORT 2025 ONLINE_NEW
P. 46
44 • Republic Financial Holdings Limited 2025 Annual Report • EXECUTIVE REPORTS
Group President and CEO’s Discussion and Analysis
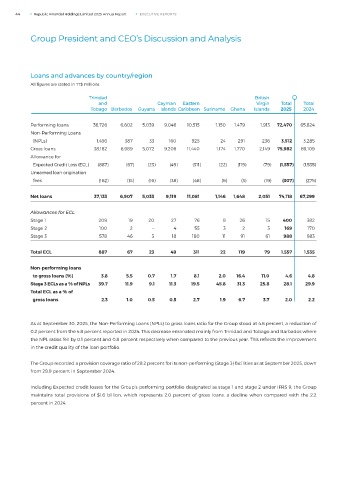
Loans and advances by country/region
All figures are stated in TT$ millions
Trinidad British
and Cayman Eastern Virgin Total Total
Tobago Barbados Guyana Islands Caribbean Suriname Ghana Islands 2025 2024
Performing loans 36,726 6,602 5,039 9,046 10,515 1,150 1,479 1,913 72,470 65,824
Non-Performing Loans
(NPLs) 1,456 387 33 160 925 24 291 236 3,512 3,285
Gross loans 38,182 6,989 5,072 9,206 11,440 1,174 1,770 2,149 75,982 69,109
Allowance for
Expected Credit Loss (ECL) (887) (67) (23) (49) (311) (22) (119) (79) (1,557) (1,535)
Unearned loan origination
fees (162) (15) (16) (38) (48) (6) (3) (19) (307) (275)
Net loans 37,133 6,907 5,033 9,119 11,081 1,146 1,648 2,051 74,118 67,299
Allowances for ECL
Stage 1 209 19 20 27 76 8 26 15 400 382
Stage 2 100 2 – 4 55 3 2 3 169 170
Stage 3 578 46 3 18 180 11 91 61 988 983
Total ECL 887 67 23 49 311 22 119 79 1,557 1,535
Non-performing loans
to gross loans (%) 3.8 5.5 0.7 1.7 8.1 2.0 16.4 11.0 4.6 4.8
Stage 3 ECLs as a % of NPLs 39.7 11.9 9.1 11.3 19.5 45.8 31.3 25.8 28.1 29.9
Total ECL as a % of
gross loans 2.3 1.0 0.5 0.5 2.7 1.9 6.7 3.7 2.0 2.2
As at September 30, 2025, the Non-Performing Loans (NPLs) to gross loans ratio for the Group stood at 4.6 percent, a reduction of
0.2 percent from the 4.8 percent reported in 2024. This decrease emanated mainly from Trinidad and Tobago and Barbados where
the NPL ratios fell by 0.1 percent and 0.8 percent respectively when compared to the previous year. This reflects the improvement
in the credit quality of the loan portfolio.
The Group recorded a provision coverage ratio of 28.2 percent for its non-performing (Stage 3) facilities as at September 2025, down
from 29.9 percent in September 2024.
Including Expected credit losses for the Group’s performing portfolio designated as stage 1 and stage 2 under IFRS 9, the Group
maintains total provisions of $1.6 billion, which represents 2.0 percent of gross loans, a decline when compared with the 2.2
percent in 2024.