
Page 10 - Kiplinger's Personal Finance - November 2018
P. 10
INVESTING
History Lesson
Match Your Portfolio to Your Risk Tolerance
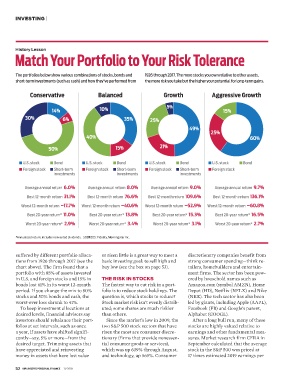
The portfolios below show various combinations of stocks, bonds and 1926 through 2017. The more stocks you own relative to other assets,
short-term investments (such as cash) and how they’ve performed from the more risk you take but the higher your potential for long-term gains.
Conservative Balanced Growth Aggressive Growth
14% 10% 5% 15%
30% 6% 35% 25%
49%
25%
40% 60%
50% 15% 21%
■ U.S. stock ■ Bond ■ U.S. stock ■ Bond ■ U.S. stock ■ Bond ■ U.S. stock ■ Bond
■ Foreign stock ■ Short-term ■ Foreign stock ■ Short-term ■ Foreign stock ■ Short-term ■ Foreign stock
investments investments investments
Average annual return 6.0% Average annual return 8.0% Average annual return 9.0% Average annual return 9.7%
Best 12-month return 31.1% Best 12-month return 76.6% Best 12-month return 109.6% Best 12-month return 136.1%
Worst 12-month return –17.7% Worst 12-month return –40.6% Worst 12-month return –52.9% Worst 12-month return –60.8%
Best 20-year return* 11.0% Best 20-year return* 13.8% Best 20-year return* 15.3% Best 20-year return* 16.5%
Worst 20-year return* 2.9% Worst 20-year return* 3.4% Worst 20-year return* 3.1% Worst 20-year return* 2.7%
*Annualized return; includes reinvested dividends. SOURCES: Fidelity, Morningstar Inc.
suffered by different portfolio alloca- or risen little is a great way to meet a discretionary companies benefit from
tions from 1926 through 2017 (see the basic investing goal: to sell high and strong consumer spending—think re-
chart above). The firm found that a buy low (see the box on page 53). tailers, homebuilders and entertain-
portfolio with 85% of assets invested ment firms. The sector has been pow-
in U.S. and foreign stocks and 15% in THE RISK IN STOCKS ered by household names such as
bonds lost 61% in its worst 12-month The fastest way to cut risk in a port- Amazon.com (symbol AMZN), Home
period. If you change the mix to 50% folio is to reduce stock holdings. The Depot (HD), Netflix (NFLX) and Nike
stocks and 50% bonds and cash, the question is, which stocks to reduce? (NKE). The tech sector has also been
worst-ever loss shrank to 41%. Stock market risk isn’t evenly distrib- led by giants, including Apple (AAPL),
To keep investment allocations at uted; some shares are much riskier Facebook (FB) and Google’s parent,
desired levels, financial advisers say than others. Alphabet (GOOGL).
investors should rebalance their port- Since the market’s low in 2009, the After a long bull run, many of these
folios at set intervals, such as once two S&P 500 stock sectors that have stocks are highly valued relative to
a year, if assets have shifted signifi- risen the most are consumer discre- earnings and other fundamental mea-
cantly—say, 5% or more—from the tionary (firms that provide nonessen- sures. Market research firm CFRA in
desired target. Trimming assets that tial consumer goods or services), September calculated that the average
have appreciated and reinvesting which was up 639% through August, stock in the S&P 500 was priced at
money in assets that have lost value and technology, up 565%. Consumer 17 times estimated 2019 earnings per
52 KIPLINGER’S PERSONAL FINANCE 11/2018
K11I-BETTER INVESTOR.a.indd 52 9/21/18 3:03 PM