
Page 9 - Demo
P. 9
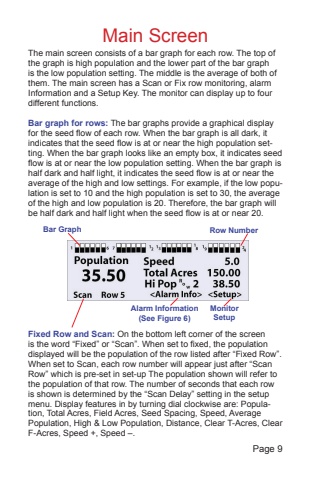
Fixed Row and Scan: On the bottom left corner of the screen is the word %u201cFixed%u201d or %u201cScan%u201d. When set to fixed, the population displayed will be the population of the row listed after %u201cFixed Row%u201d. When set to Scan, each row number will appear just after %u201cScan Row%u201d which is pre-set in set-up The population shown will refer to the population of that row. The number of seconds that each row is shown is determined by the %u201cScan Delay%u201d setting in the setup menu. Display features in by turning dial clockwise are: Population, Total Acres, Field Acres, Seed Spacing, Speed, Average Population, High & Low Population, Distance, Clear T-Acres, Clear F-Acres, Speed +, Speed %u2013.Page 9Main ScreenThe main screen consists of a bar graph for each row. The top of the graph is high population and the lower part of the bar graph is the low population setting. The middle is the average of both of them. The main screen has a Scan or Fix row monitoring, alarm Information and a Setup Key. The monitor can display up to four different functions.Bar graph for rows: The bar graphs provide a graphical display for the seed flow of each row. When the bar graph is all dark, it indicates that the seed flow is at or near the high population setting. When the bar graph looks like an empty box, it indicates seed flow is at or near the low population setting. When the bar graph is half dark and half light, it indicates the seed flow is at or near the average of the high and low settings. For example, if the low population is set to 10 and the high population is set to 30, the average of the high and low population is 20. Therefore, the bar graph will be half dark and half light when the seed flow is at or near 20.Bar Graph Row NumberAlarm Information(See Figure 6)Monitor Setup
