
Page 16 - Destination Risk and Resilience Manual-Namibia
P. 16
TOURISM SYSTEM
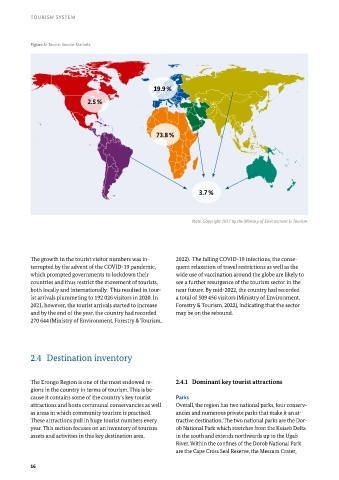
Figure 5: Tourist Source Markets
19 9 %
2 5 %
73 8 %
3 7 %
Note. Copyright 2017 by the Ministry of Environment & Tourism.
The growth in the tourist visitor numbers was in- 2022). The falling COVID-19 infections, the conse-
terrupted by the advent of the COVID-19 pandemic, quent relaxation of travel restrictions as well as the
which prompted governments to lockdown their wide use of vaccination around the globe are likely to
countries and thus restrict the movement of tourists, see a further resurgence of the tourism sector in the
both locally and internationally. This resulted in tour- near future. By mid-2022, the country had recorded
ist arrivals plummeting to 192 026 visitors in 2020. In a total of 509 456 visitors (Ministry of Environment,
2021, however, the tourist arrivals started to increase Forestry & Tourism, 2022), indicating that the sector
and by the end of the year, the country had recorded may be on the rebound.
270 644 (Ministry of Environment, Forestry & Tourism,
2.4 Destination inven tory
The Erongo Region is one of the most endowed re- 2.4.1 Dominant key tourist attractions
gions in the country in terms of tourism. This is be-
cause it contains some of the country’s key tourist Parks
attractions and hosts communal conservancies as well Overall, the region has two national parks, four conserv-
as areas in which community tourism is practised. ancies and numerous private parks that make it an at-
These attractions pull in huge tourist numbers every tractive destination. The two national parks are the Dor-
year. This section focuses on an inventory of tourism ob National Park which stretches from the Kuiseb Delta
assets and activities in this key destination area. in the south and extends northwards up to the Ugab
River. Within the confines of the Dorob National Park
are the Cape Cross Seal Reserve, the Messum Crater,
16