
Page 160 - Bahrain Gov Annual Reports (IV)_Neat
P. 160
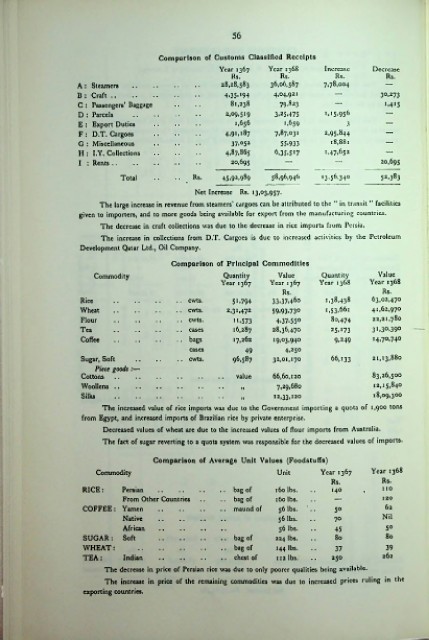
56


                                    Comparison  of Customs Classified Receipts
                                                 Year 1367 Year 1368    Increase   Decrease
                                                    Rs.       Rs.         Rs.        Rs.
                  A : Steamers                   28,28,583  36,06,587   7,78,004
                  B : Craft ..                    4»35.*94   4,04,921               30,273
                  C : Passengers’ Baggage          81,238     79.823                 *,4I5
                  D : Parcels                     2,09,519   3.25.475   '»*5,956
                  E : Export Duties                 1,656      1,659         3
                  F: D.T. Cargoes                 4,91,187   7.87.03«   2,95.844
                  G : Miscellaneous                 37.052    55.933     18,881
                  H: I.Y. Collections             4,87,865   6,35.5*7   1.47.652
                  I : Rents ..                      20,695                          20,695
                           Total           Rs.    45.92,989  58,96,946  *3.56,340   52,383
                                            Net Increase Rs. 13,03,957.
                       The large increase in revenue from steamers’ cargoes can be attributed to the “ in transit ” facilities
                  given to importers, and to more goods being available for export from the manufacturing countries.
                       The decrease in craft collections was due to the decrease in rice imports from Persia.
                       The increase in collections from D.T. Cargoes is due to increased activities by the Petroleum
                  Development Qatar Ltd., Oil Company.
                                      Comparison of Principal Commodities
                      Commodity                   Quantity    Value    Quantity     Value
                                                 Year 1367  Year 1367  Year 1368  Year 1368
                                                               Rs.                   Rs.
                   Rice                   cwts.     5 *.794   33.37.46o  1,38,438  63,02,470
                   Wheat                  cwts.    2.3 *.472   59.93.73°  i,53.66i  41.62,970
                   Flour                  cwts.     **.573   4.37,55°    80,474   22,21,780
                   Tea                    cases     16,287   28,36,470   25.*73   3*.3°.39°
                   Coffee                 bags      17,262   *9.03.94°    9.249    I4»7°»74°
                                          cases        49      4.25°
                   Sugar, Soft          .. cwts.    96,587   32,01,170   66,133   21,13,880
                      Piece goods :—
                   Cottons                           value   66.60.120            83,26,500
                   Woollens                           II     7.29.680              12,15,840
                   Silks                              II     12.33.120             18,09,300
                       The increased value of rice imports was due to the Government importing a quota of 1,900 tons
                   from Egypt, and increased imports of Brazilian rice by private enterprise.
                       Decreased values of wheat are due to the increased values of flour imports from Australia.
                       The fact of sugar reverting to a quota system was responsible for the decreased values of imports.

                                   Comparison of Average Unit Values (Foodstuffs)
                      Commodity                              Unit      Year 1367  Year 1368
                                                                         Rs.         Rs.
                   RICE:    Persian .........................  .. bag of   160 lbs.   140  110
                            From Other Countries  .. bag of   160 lbs.               120
                   COFFEE: Yamen                 .. maund of  56 lbs.     5°         62
                            Native                            56 lbs.     70         Nil
                            African                           56 lbs.     45         5°
                   SUGAR: Soft                      bag of   224 lbs.     80         80
                   WHEAT:                           bag of   144 lbs.     37         39
                   TEA:     Indian                  chest of  112 lbs.    250        262
                        The decrease in price of Persian rice was due to only poorer qualities being available.
                        The increase in price of the remaining commodities was due to increased prices ruling in the
                   exporting countries.