
Page 259 - Bahrain Gov Annual Reports (III)_Neat
P. 259
51
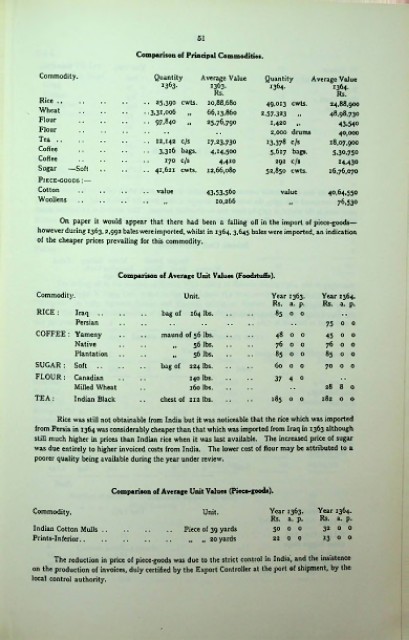
Comparison of Principal Commodities.
Commodity. Quantity Average Value Quantity Average Value
1363. 1363. 1364. 1364-
Rs. Rs.
Rice .. 25.390 cwts. 10,88,680 49,013 cwts. 24.88.900
Wheat 3,31,006 „ 66,13,860 2.57.323 48.98.730
Flour 97.840 .» 25,76,790 1.420 • 9 43.540
9 •
Flour 2,000 drums 40,000
Tea 12,142 c/s 17.23.730 13.378 c/s 18.07.900
Coffee 3,316 bags. 4.M.500 5,617 bags. 5.30.750
Coffee 170 c/s 4,410 292 c/s 14.430
Sugar —Soft 41,621 cwts. 12,66,080 52,850 cwts. 16.76,070
Piece-goods :—
Cotton value 43.53.56o value 40.64.550
Woollens 10,266 76.530
If If
On paper it would appear that there had been a falling off in the import of piece-goods—
however during 1363,2,992 bales were imported, whilst in 1364, 3,645 bales were imported, an indication
of the cheaper prices prevailing for this commodity.
Comparison of Average Unit Values (Foodstuffs).
Commodity. Unit. Year 1363. Year 1364.
Rs. a. p. Rs. a. p.
RICE: Iraq .. bag of 164 lbs. 85 o 0
Persian 75 o 0
COFFEE: Yameny maund of 56 lbs. 48 0 o 45 0 o
Native #9 56 lbs. 76 o 0 76 0 o
Plantation 56 lbs. 85 o o 85 o o
If
SUGAR: Soft .. bag of 224 lbs. 60 o 0 70 0 0
FLOUR: Canadian 140 lbs. 37 4 0
Milled Wheat 160 lbs. 28 8 o
TEA: Indian Black chest of 112 lbs. 185 0 o 182 0 o
Rice was still not obtainable from India but it was noticeable that the rice which was imported
from Persia in 1364 was considerably cheaper than that which was imported from Iraq in 1363 although
still much higher in prices than Indian rice when it was last available. The increased price of sugar
was due entirely to higher invoiced costs from India. The lower cost of flour may be attributed to a
poorer quality being available during the year under review.
Comparison of Average Unit Values (Piece-goods).
Commodity. Unit. Year 1363. Year 1364.
Rs. a. p. Rs. a. p.
Indian Cotton Mulls .. Piece of 39 yards 50 0 o 32 0 0
Prints-Inferior.. .. „ „ 20 yards 22 o 0 13 0 0
The reduction in price of piece-goods was due to the strict control in India, and the insistence
on the production of invoices, duly certified by the Export Controller at the port of shipment, by the
local control authority.