
Page 285 - Onboarding May 2017
P. 285
Procurement
Commodity Costs
Throughout 2015, we experienced stagnation in world demand and growing softness in most commodities. Political events and unrest
in key geographies and economic malaise, led by Chinese GDP slowing to 6.9% in 2015 – its lowest growth rate since 1990 – dampened
world demand and helped to drive the U.S. dollar to its highest levels since 2001. Our strong US$ makes U.S. exports more expensive
and world supply for import more attractive. A glut of oil supply and little slowdown in production has driven oil to levels not seen since
the early 2000’s. With slowing world demand, a strong US$, and generally high output of supply, a broad base of commodity markets
experienced deflation in 2015. The Producer Price Index (PPI) for All Commodities was down approximately 3.1% for 2015 versus 2014.
Applebee’s Market Basket
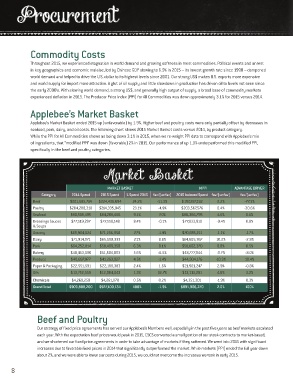
Applebee’s Market Basket ended 2015 up (unfavorable) by 1.9%. Higher beef and poultry costs were only partially offset by decreases in
seafood, pork, dairy, and oil costs. The following chart shows 2015 Market Basket costs versus 2014, by product category.
While the PPI for All Commodities shows as being down 3.1% in 2015, when we re-weight PPI data to correspond with Applebee’s mix
of ingredients, that “modified PPI” was down (favorable) 2% in 2015. Our performance of up 1.9% underperformed this modified PPI,
specifically in the beef and poultry categories.
Market Basket
MARKET BASKET MPPI ADVANTAGE DRIVER
Category 2014 Spend 2015 Spend % Spend 2015 fav/(unfav) 2015 Indexed Spend fav/(unfav) fav/(unfav)
Beef $201,685,714 $224,436,694 24.2% -11.3% $197,287,192 2.2% -77.3%
Poultry $204,288,310 $214,335,945 23.1% -4.9% $203,567,576 0.4% -30.6%
Seafood $90,519,495 $84,209,466 9.1% 7.0% $86,366,795 4.6% 6.1%
Dressings Sauces $77,519,297 $77,558,148 8.4% -0.1% $77,833,910 -0.4% 0.8%
& Soups
Grocery $69,904,024 $71,256,958 7.7% -1.9% $70,655,211 -1.1% -1.7%
Dairy $71,914,071 $65,590,333 7.1% 8.8% $64,605,367 10.2% -2.8%
Pork $64,252,814 $58,409,358 6.3% 9.1% $58,602,370 8.8% 0.5%
Bakery $48,453,090 $51,584,803 5.6% -6.5% $48,777,844 -0.7% -8.0%
Produce $40,697,977 $41,263,927 4.5% -1.4% $44,904,176 -10.3% 10.4%
Paper & Packaging $22,551,591 $22,189,383 2.4% 1.6% $21,901,247 2.9% -0.8%
Oils $13,752,559 $12,004,043 1.3% 12.7% $13,113,281 4.6% 3.2%
Chemicals $4,269,258 $4,261,078 0.5% 0.2% $4,351,301 -1.9% 0.3%
Grand Total $909,808,200 $927,100,134 100% -1.9% $891,966,270 2.0% 100%
Beef and Poultry
Our strategy of fixed price agreements has served our Applebee’s Members well, especially in the past five years as beef markets escalated
each year. With the expectation beef prices would peak in 2015, CSCS converted a small portion of our steak contracts to market-based,
and we shortened our fixed price agreements in order to take advantage of markets if they softened. We went into 2015 with significant
increases due to favorable fixed prices in 2014 that significantly outperformed the market. While markets (PPI) ended the full year down
about 2%, and we were able to lower our costs during 2015, we could not overcome the increases we took in early 2015.
8