
Page 10 - Amniotic Portfolio - RV4 2020 w_ WP
P. 10
Eur Spine J (2009) 18:1202–1212 1207
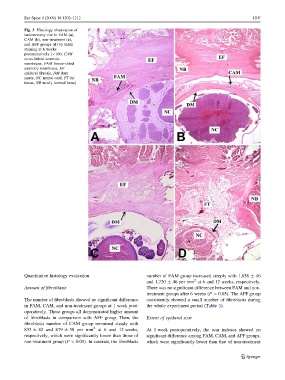
Fig. 3 Histology observation of
laminectomy site in FAM (a),
CAM (b), non-treatment (c),
and AFF groups (d) by H&E
staining at 6 weeks
postoperatively (9100; CAM
cross-linked amniotic
membrane, FAM freeze–dried
amniotic membrane, EF
epidural fibrosis, DM dura
mater, NC neural cord, FT fat
tissue, NB newly formed bone)
Quantitative histology evaluation number of FAM group increased steeply with 1,638 ± 46
2
and 1,720 ± 46 per mm at 6 and 12 weeks, respectively.
Amount of fibroblasts There was no significant difference between FAM and non-
treatment groups after 6 weeks (P [ 0.05). The AFF group
The number of fibroblasts showed no significant difference consistently showed a small number of fibroblasts during
in FAM, CAM, and non-treatment groups at 1 week post- the whole experiment period (Table 3).
operatively. These groups all demonstrated higher amount
of fibroblasts in comparison with AFF group. Then, the Extent of epidural scar
fibroblasts number of CAM group remained steady with
2
833 ± 42 and 879 ± 58 per mm at 6 and 12 weeks, At 1 week postoperatively, the scar indexes showed no
respectively, which were significantly lower than those of significant difference among FAM, CAM, and AFF groups,
non-treatment group (P \ 0.05). In contrast, the fibroblasts which were significantly lower than that of non-treatment
123