
Page 11 - Amniotic Portfolio - RV4 2020 w_ WP
P. 11
1208 Eur Spine J (2009) 18:1202–1212
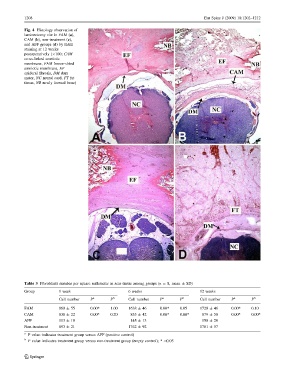
Fig. 4 Histology observation of
laminectomy site in FAM (a),
CAM (b), non-treatment (c),
and AFF groups (d) by H&E
staining at 12 weeks
postoperatively (9100; CAM
cross-linked amniotic
membrane, FAM freeze–dried
amniotic membrane, EF
epidural fibrosis, DM dura
mater, NC neural cord, FT fat
tissue, NB newly formed bone)
Table 3 Fibroblasts number per square millimeter in scar tissue among groups (n = 8, mean ± SD)
Group 1 week 6 weeks 12 weeks
Cell number P a P b Cell number P a P b Cell number P a P b
FAM 860 ± 55 0.00* 1.00 1638 ± 46 0.00* 0.05 1720 ± 46 0.00* 0.10
CAM 838 ± 22 0.00* 0.20 833 ± 42 0.00* 0.00* 879 ± 58 0.00* 0.00*
AFF 113 ± 18 145 ± 13 150 ± 20
Non-treatment 893 ± 21 1762 ± 92 1781 ± 57
a
P value indicates treatment group versus AFF (positive control)
b
P value indicates treatment group versus non-treatment group (empty control); * \0.05
123