
Page 8 - Amniotic Portfolio - RV4 2020 w_ WP
P. 8
Eur Spine J (2009) 18:1202–1212 1205
non-treatment group. Because of severe adhesions between tenacity showed no significant difference among groups
surrounding muscles and dura mater, dissection was diffi- due to less scar formation. The scores ranged from
cult and time-consuming. Removal of scar tissue could 0.25 ± 0.46 to 0.75 ± 0.71 in groups. After 6 weeks, the
easily lead to injuries to dura mater and nerve roots. mean scores were 4.38 ± 0.74 and 0.50 ± 0.76 in non-
Grading scores ranged from 2 to 3 and the mean score was treatment group and AFF group, respectively. The score of
2.88 ± 0.35. In AFF group, less epidural scar was FAM group was 3.63 ± 1.51, which was not significantly
observed and re-exposure of dura mater and nerve roots different from that of non-treatment group (P [ 0.05). In
was easy. The mean score was 0.63 ± 0.74, which was contrast, the scar was easily detached off in CAM group
significantly lower than that of non-treatment group with rather lower score of 0.63 ± 0.74. The scar amounts
(P \ 0.05). In FAM group, the dense scar was found and adhesion tenacity of CAM group were both signifi-
between dura mater and overlying muscles with grade of cantly lower than that of non-treatment group. After
2.13 ± 1.13. There was no significant difference in scar 12 weeks, the score increased slowly with 0.88 ± 0.83 in
amounts between FAM and non-treatment groups CAM group, which was still significantly lower than those
(P [ 0.05). In CAM group, a much weaker or nearly of FAM group and non-treatment group (Table 2).
absent epidural adhesion was recorded. The white, slightly
vascularized membrane was found between dura mater and Qualitative histology evaluation
surrounding muscles to reduce scar intrusion. Furthermore,
the CAM layer seldom adhered to the dura mater and was At 1 week postoperatively, epidural hemorrhage was
easily removed. Only a layer of fibrous tissue could be clearly visible in FAM group, CAM group, and non-
found between the CAM layer and dura mater in three treatment group. The FAM and CAM acted as mecha-
samples. The grading score of CAM group was signifi- nical barriers to prevent epidural hemorrhage from
cantly lower than that of non-treatment group while intruding into spinal canal. In AFF group, the fat tissue
showing no significant difference in comparison with that filled the space between laminar edges and dura mater.
of AFF group. After 12 weeks, the results showed similar There were no obvious inflammatory reactions at all
trends and there was still less scar formation in CAM group laminectomy sites (Fig. 2). At 6 weeks postoperatively,
and AFF group (Table 1). The tenacity was recorded to the FAM degraded mostly and only small pieces around
indicate adhesion severity. At 1 week postoperatively, the laminar edges could be found in FAM group. The
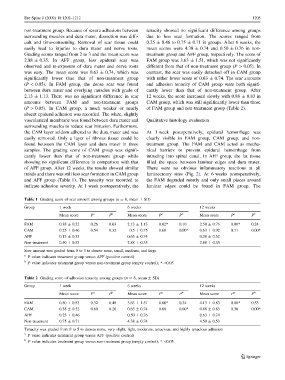
Table 1 Grading score of scar amount among groups (n = 8, mean ± SD)
Group 1 week 6 weeks 12 weeks
Mean score P a P b Mean score P a P b Mean score P a P b
FAM 0.38 ± 0.52 0.26 0.63 2.13 ± 1.13 0.02* 0.10 2.50 ± 0.76 0.00* 0.24
CAM 0.25 ± 0.46 0.54 0.32 0.5 ± 0.75 0.68 0.00* 0.63 ± 0.92 0.71 0.00*
AFF 0.13 ± 0.35 0.63 ± 0.74 0.38 ± 0.52
Non-treatment 0.50 ± 0.53 2.88 ± 0.35 2.88 ± 0.35
Scar amount was graded from 0 to 3 to denote none, small, medium, and large
a
P value indicates treatment group versus AFF (positive control)
b
P value indicates treatment group versus non-treatment group (empty control); * \0.05
Table 2 Grading score of adhesion tenacity among groups (n = 8, mean ± SD)
Group 1 week 6 weeks 12 weeks
Mean score P a P b Mean score P a P b Mean score P a P b
FAM 0.50 ± 0.53 0.32 0.48 3.63 ± 1.51 0.00* 0.34 4.13 ± 0.83 0.00* 0.53
CAM 0.38 ± 0.52 0.60 0.26 0.63 ± 0.74 0.68 0.00* 0.88 ± 0.83 0.36 0.00*
AFF 0.25 ± 0.46 0.50 ± 0.76 0.63 ± 0.74
Non-treatment 0.75 ± 0.71 4.38 ± 0.74 4.50 ± 0.53
Tenacity was graded from 0 to 5 to denote none, very slight, light, moderate, tenacious, and highly tenacious adhesion
a
P value indicates treatment group versus AFF (positive control)
b
P value indicates treatment group versus non-treatment group (empty control); * \0.05
123