
Page 7 - Amniotic Portfolio - RV4 2020 w_ WP
P. 7
1204 Eur Spine J (2009) 18:1202–1212
time point. The spine segments were removed en bloc. of epidural scar normalized to the area of spinal canal,
First, the examiners observed scar formation between the which was used to indicate the severity of epidural fibrosis.
dura mater and paraspinal muscles. A previously described In addition, the areas of newly formed bone originated
scale (0 = none, 1 = small, 2 = medium, 3 = large) was from the vertebral lamina in laminectomy defect sites were
used to evaluate the amount of scar tissue [5]. Then, each compared among groups.
sample was divided into two parts by cutting transversely
through middle line. One part was for adhesion tenacity Statistical analyses
test and the other for histology analysis. The scar was
peeled-off manually and the adhesion tenacity was evalu- All data were analyzed using SPSS 13.0 software and
ated using a reported scale. The scale was consisted of six statistically significant values were defined as P \ 0.05. A
grades: (1) Grade 0: no adhesion; (2) Grade 1: very slight Wilcoxon–Mann–Whitney test was used to determine sig-
adhesion and easily detached without applying manual nificant difference in grades of gross scar formation and
force; (3) Grade 2: light adhesion and easily detached by adhesion tenacity. The one-way analysis of variance
weak traction; (4) Grade 3: moderate adhesion and (ANOVA) and Bonferroni test was used to check the sig-
detached by moderate traction; (5) Grade 4: tenacious nificant difference in scar index, fibroblasts number, and
adhesion and detached by strong traction; (6) Grade 5: new bone formation.
highly tenacious adhesion and detached by sharp dissection
[22].
Results
Histology analysis
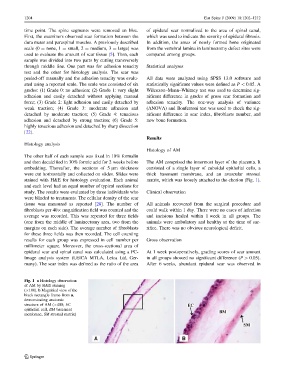
Histology of AM
The other half of each sample was fixed in 10% formalin
and then decalcified in 30% formic acid for 2 weeks before The AM comprised the innermost layer of the placenta. It
embedding. Thereafter, the sections of 5 lm thickness consisted of a single layer of cuboidal epithelial cells, a
were cut horizontally and collected on slides. Slides were thick basement membrane, and an avascular stromal
stained with H&E for histology evaluation. Each animal matrix, which was loosely attached to the chorion (Fig. 1).
and each level had an equal number of typical sections for
study. The results were evaluated by three individuals who Clinical observation
were blinded to treatments. The cellular density of the scar
tissue was measured as reported [28]. The number of All animals recovered from the surgical procedure and
fibroblasts per 409 magnification field was counted and the could walk within 1 day. There were no cases of infection
average was recorded. This was repeated for three fields and incisions healed within 1 week in all groups. The
(one from the middle of laminectomy area, two from the animals were ambulatory and healthy at the time of sac-
margins on each side). The average number of fibroblasts rifice. There was no obvious neurological deficit.
for these three fields was then recorded. The cell counting
results for each group was expressed in cell number per Gross observation
millimeter square. Moreover, the cross-sectional area of
epidural scar and spinal canal was calculated using a PC- At 1 week postoperatively, grading scores of scar amount
Image analysis system (LEICA MTLA, Leica Ltd, Ger- in all groups showed no significant difference (P [ 0.05).
many). The scar index was defined as the ratio of the area After 6 weeks, abundant epidural scar was observed in
Fig. 1 a Histology observation
of AM by H&E staining
(9100). b Magnified view of the
black rectangle frame from a,
demonstrating anatomic
structure of AM (9400; EC
epithelial cell, BM basement
membrane, SM stromal matrix)
123