
Page 122 - ASBIRES-2017_Preceedings
P. 122
Nimasha, Dharmawardhane & Appuhamy
standard level than other provinces. Table 1 given below shows Cronbach’s alpha value.
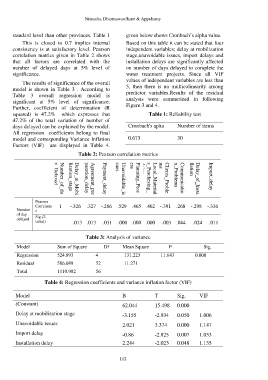
This is closed to 0.7 implies internal Based on this table it can be stated that four
consistency is at satisfactory level. Pearson independent variables; delay at mobilization
correlation matrics given in Table 2 shows stage,unavoidable issues, import delays and
that all factors are correlated with the installation delays are significantly affected
number of delayed days at 5% level of on number of days delayed to complete the
significance. water treatment projects. Since all VIF
values of independent variables are less than
The results of significance of the overall
model is shown in Table 3 . According to 5, then there is no multicolinearity among
Table 3 overall regression model is predictor variables.Results of the residual
significant at 5% level of significance. analysis were summerized in following
Further, coefficient of determination (R Figure 3 and 4.
squared) is 47.2% which expresses that Table 1: Reliability test
47.2% of the total variation of number of
days delayed can be explained by the model. Cronbach's apha Number of items
All regression coefficients belong to final
model and corresponding Variance Inflation 0.673 30
Factors (VIF) are displayed in Table 4.
Table 2: Pearson correlation metrics
Unavoidable_is ess Planning_Proc delay s_Purchesing_ Local_Material ms Clients_Proble n_Problems Communicatio llation Delay_of_Insta Import_delay
sues
y_Delayed
lization_stage
Number_of_da
Agreement_pre
paration_delay
Delay_at_Mobi
Payment_delay
Pearson
Correlatio 1 -.326 .327 -.286 .529 .465 .462 -.391 .268 -.298 -.336
Number n
of day
delayed Sig.(2-
tailed) .013 .013 .031 .000 .000 .000 .003 .044 .024 .011
Table 3: Analysis of variance
Model Sum of Square Df Mean Square F Sig.
Regression 524.893 4 131.223 11.643 0.000
Residual 586.089 52 11.271
Total 1110.982 56
Table 4: Regression coefficients and variance inflation factor (VIF)
Model B T Sig. VIF
(Constant) 62.044 15.498 0.000
Delay at mobilization stage -3.155 -2.934 0.050 1.006
Unavoidable issues 2.021 3.374 0.000 1.147
Import delay -0.86 -2.825 0.007 1.053
Installation delay 2.244 -2.023 0.048 1.135
112