
Page 78 - ASBIRES-2017_Preceedings
P. 78
Ganegoda, Wickramasinghe & Appuhamy
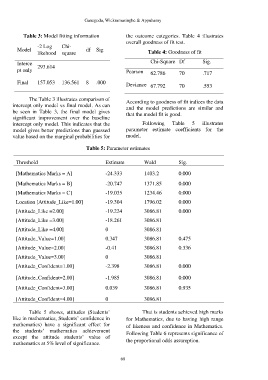
Table 3: Model fitting information the outcome categories. Table 4 illustrates
overall goodness of fit test.
-2 Log Chi-
Model df Sig
likehood square Table 4: Goodness of fit
Interce Chi-Square Df Sig.
pt only 293.614 Pearson 62.786 70 .717
Final 157.053 136.561 8 .000 Deviance 67.792 70 .553
The Table 3 illustrates comparison of According to goodness of fit indices the data
intercept only model vs final model. As can and the model predictions are similar and
be seen in Table 3, the final model gives that the model fit is good.
significant improvement over the baseline
intercept only model. This indicates that the Following Table 5 illustrates
model gives better predictions than guessed parameter estimate coefficients for the
value based on the marginal probabilities for model.
Table 5: Parameter estimates
Threshold Estimate Wald Sig.
[Mathematics Marks = A] -24.333 1403.2 0.000
[Mathematics Marks = B] -20.747 1371.85 0.000
[Mathematics Marks = C] -19.035 1234.46 0.000
Location [Attitude_Like=1.00] -19.304 1796.02 0.000
[Attitude_Like =2.00] -19.224 3086.81 0.000
[Attitude_Like =3.00] -18.261 3086.81
[Attitude_Like =4.00] 0 3086.81
[Attitude_Value=1.00] 0.347 3086.81 0.475
[Attitude_Value=2.00] -0.41 3086.81 0.336
[Attitude_Value=3.00] 0 3086.81
[Attitude_Confident=1.00] -2.398 3086.81 0.000
[Attitude_Confident=2.00] -1.985 3086.81 0.000
[Attitude_Confident=3.00] 0.039 3086.81 0.935
[Attitude_Confident=4.00] 0 3086.81
Table 5 shows, attitudes (Students’ That is students achieved high marks
like in mathematics, Students’ confidence in for Mathematics, due to having high range
mathematics) have a significant effect for of likeness and confidence in Mathematics.
the students’ mathematics achievement Following Table 6 represents significance of
except the attitude students’ value of
mathematics at 5% level of significance. the proportional odds assumption.
68