Page 93 - ASBIRES-2017_Preceedings
P. 93

FACTORS AFFECTING TO THE MATERIAL CONSUMPTION: A CASE STUDY OF A TYRE COMPANY IN
                                                              SRI LANKA

                     (October-2015  to  October-2016)  were
                     considered.  Material  consumption  values,
                     purchase requests (PR) and purchase orders
                     (PO)  data  were  taken  for  each  material  by
                     Microsoft excel pivot table command. Lead
                     times, reorder points and safety stock values
                     were  taken  from  the  material  master  table.
                     Finally, materials were categorized into two
                     types (non-stock and stock) by using filters.

                          5 RESULTS AND DISCUSSION

                     5.1 Descriptive Analysis


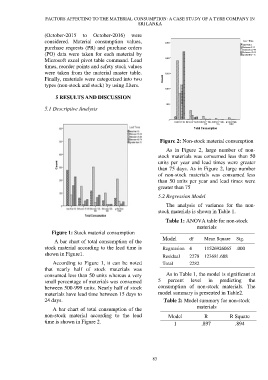
                                                                        Figure 2: Non-stock material consumption

                                                                           As  in  Figure  2,  large  number  of  non-
                                                                       stock materials was consumed  less than 50
                                                                       units  per  year  and  lead  times  were  greater
                                                                       than 75 days. As in Figure 2, large number

                                                                       of  non-stock  materials  was  consumed  less
                                                                       than 50 units per year and lead times were
                                                                       greater than 75

                                                                       5.2 Regression Model
                                                                           The  analysis  of  variance  for  the  non-
                                                                       stock materials is shown in Table 1.

                                                                           Table 1: ANOVA table for non-stock

                                                                                        materials
                        Figure 1: Stock material consumption
                                                                         Model       df     Mean Square  Sig.
                         A bar chart of total consumption of the
                     stock material according to the lead time is        Regression  4      11526926065  .000
                     shown in Figure1.                                   Residual    2278  123681.688

                        According  to  Figure  1,  it  can  be  noted    Total       2282
                     that  nearly  half  of  stock  materials  was
                     consumed less than 50 units whereas a very            As in Table 1, the model is significant at
                     small percentage of materials was consumed        5    percent   level   in   predicting   the
                     between 500-999 units. Nearly half of stock       consumption  of  non-stock  materials.  The
                     materials have lead time between 15 days to       model summary is presented in Table2.

                     24 days.                                             Table 2: Model summary for non-stock
                                                                                        materials
                        A bar chart of total consumption of the
                     non-stock  material  according  to  the  lead          Model           R          R Square
                     time is shown in Figure 2.                               1           .897           .894


                                                                     83
   88   89   90   91   92   93   94   95   96   97   98