
Page 94 - ASBIRES-2017_Preceedings
P. 94
Rahubaddha, Dharmawardane & Wickramasinghe
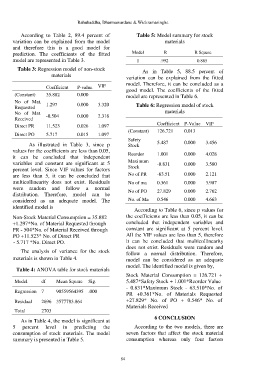
According to Table 2, 89.4 percent of Table 5: Model summary for stock
variation can be explained from the model materials
and therefore this is a good model for
prediction. The coefficients of the fitted Model R R Square
model are represented in Table 3. 1 .992 0.885
Table 3: Regression model of non-stock As in Table 5, 88.5 percent of
materials
variation can be explained from the fitted
Coefficient P-value VIF model. Therefore, it can be concluded as a
good model. The coefficients of the fitted
(Constant) 35.882 0.000 model are represented in Table 6.
No of Mat. 1.297 0.000 3.320
Requested Table 6: Regression model of stock
No of Mat. -0.504 0.000 2.318 materials
Received
Direct PR 11.523 0.026 1.097 Coefficient P-Value VIF
(Constant) 126.721 0.013
Direct PO 5.717 0.015 1.097
Safety 5.487 0.000 3.456
As illustrated in Table 3, since p Stock
values for the coefficients are less than 0.05, Reorder 1.001 0.000 4.028
it can be concluded that independent
variables and constant are significant at 5 Maximum -0.831 0.000 3.580
percent level. Since VIF values for factors Stock
are less than 5, it can be concluded that No of PR -63.51 0.000 2.121
multicollinearity does not exist. Residuals No of ma 0.361 0.000 3.987
were random and follow a normal No of PO 27.829 0.000 2.762
distribution. Therefore, model can be
considered as an adequate model. The No. of Ma 0.546 0.000 4.663
identified model is
According to Table 6, since p values for
Non-Stock Material Consumption = 35.882 the coefficients are less than 0.05, it can be
+1.297*No. of Material Requested through concluded that independent variables and
PR - 504*No. of Material Received through constant are significant at 5 percent level.
PO +11.523* No. of Direct PR All the VIF values are less than 5, therefore
- 5.717 *No. Direct PO. it can be concluded that multicollinearity
does not exist. Residuals were random and
The analysis of variance for the stock follow a normal distribution. Therefore,
materials is shown in Table 4. model can be considered as an adequate
model. The identified model is given by,
Table 4: ANOVA table for stock materials
Stock Material Consumption = 126.721 +
Model df Mean Square Sig. 5.487*Safety Stock + 1.001*Reorder Value
- 0.831*Maximum Stock - 63.510*No. of
Regression 7 90559564395 .000
PR +0.361*No. of Materials Requested
Residual 2696 3577783.864 +27.829* No. of PO + 0.546* No. of
Materials Received
Total 2703
6 CONCLUSION
As in Table 4, the model is significant at
5 percent level in predicting the According to the two models, there are
consumption of stock materials. The model seven factors that affect the stock material
summary is presented in Table 5. consumption whereas only four factors
84