
Page 51 - SE Outlook Regions 2023
P. 51
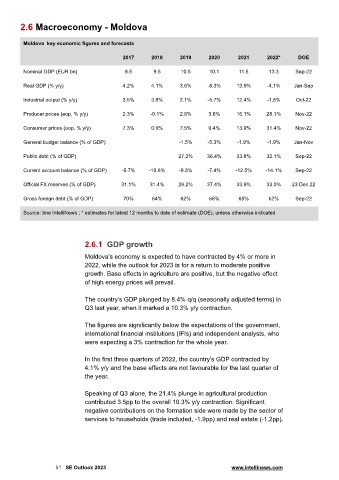
2.6 Macroeconomy - Moldova


         Moldova  key economic figures and forecasts

                                            2017      2018      2019      2020       2021      2022*      DOE

         Nominal GDP (EUR bn)                8.5       9.5       10.5      10.1      11.5       13.3     Sep-22

         Real GDP (% y/y)                   4.2%      4.1%      3.6%      -8.3%     13.9%      -4.1%    Jan-Sep

         Industrial output (% y/y)          3.5%      3.8%      2.1%      -5.7%     12.4%      -1.6%     Oct-22

         Producer prices (eop, % y/y)       2.3%      -0.1%     2.6%      3.8%      16.1%      28.1%     Nov-22

         Consumer prices (eop, % y/y)       7.3%      0.9%      7.5%      0.4%      13.9%      31.4%     Nov-22

         General budget balance (% of GDP)                      -1.5%     -5.3%     -1.9%      -1.9%    Jan-Nov


         Public debt (% of GDP)                                 27.2%     36.4%     33.8%      32.1%     Sep-22

         Current account balance (% of GDP)  -5.7%   -10.6%     -9.3%     -7.4%     -12.5%    -14.1%     Sep-22

         Official FX reserves (% of GDP)    31.1%     31.4%     29.2%     37.4%     33.9%      33.0%    23 Dec.22

         Gross foreign debt (% of GDP)      70%       64%        62%       68%       65%       62%       Sep-22

         Source: bne IntelliNews ; * estimates for latest 12 months to date of estimate (DOE), unless otherwise indicated


                               2.6.1 GDP growth

                               Moldova’s economy is expected to have contracted by 4% or more in
                               2022, while the outlook for 2023 is for a return to moderate positive
                               growth. Base effects in agriculture are positive, but the negative effect
                               of high energy prices will prevail.


                               The country’s GDP plunged by 8.4% q/q (seasonally adjusted terms) in
                               Q3 last year, when it marked a 10.3% y/y contraction.

                               The figures are significantly below the expectations of the government,
                               international financial institutions (IFIs) and independent analysts, who
                               were expecting a 3% contraction for the whole year.


                               In the first three quarters of 2022, the country’s GDP contracted by
                               4.1% y/y and the base effects are not favourable for the last quarter of
                               the year.


                               Speaking of Q3 alone, the 21.4% plunge in agricultural production
                               contributed 3.5pp to the overall 10.3% y/y contraction. Significant
                               negative contributions on the formation side were made by the sector of
                               services to households (trade included, -1.9pp) and real estate (-1.2pp).


                     51 SE Outlook 2023                                           www.intellinews.com