
Page 235 - ce_cusco_2019
P. 235
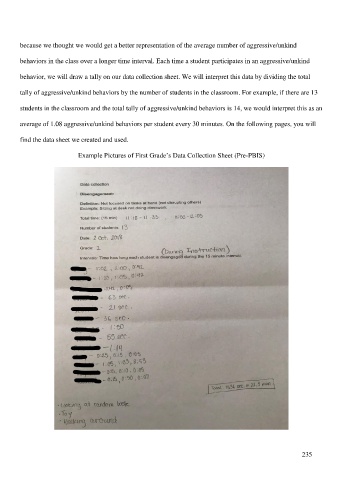
because we thought we would get a better representation of the average number of aggressive/unkind

        behaviors in the class over a longer time interval. Each time a student participates in an aggressive/unkind


        behavior, we will draw a tally on our data collection sheet. We will interpret this data by dividing the total

        tally of aggressive/unkind behaviors by the number of students in the classroom. For example, if there are 13


        students in the classroom and the total tally of aggressive/unkind behaviors is 14, we would interpret this as an

        average of 1.08 aggressive/unkind behaviors per student every 30 minutes. On the following pages, you will


        find the data sheet we created and used.

                            Example Pictures of First Grade’s Data Collection Sheet (Pre-PBIS)


                                                                                                           235