
Page 519 - Area X - G
P. 519
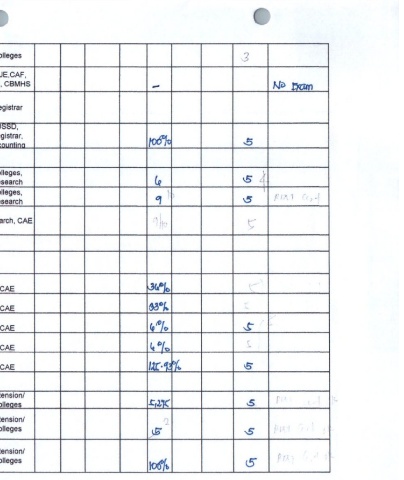
Percentage of graduates (2 years prior) that are
 employed  38%  38%  Colleges                             3
 Percentage of first-time licensure examination   CCJE.CAF,
 takers that pass the licensure exam  70%  70%  70%  70%  COE, CBMHS
 Percentage of undergraduate student population
 enrolled in CHED-identified and RDC-identified   86%  86%  86%  86%  Registrar
 priority courses/ programs
 -----D5SD]-----
 Percentage of clients who rated services as
 satisfactory using the client's feedback form  95%  95%  95%  95%  Registrar,
 Accountina                         fOtf?0                 s5
 •2 STRONG RESEARCH LEADERSHIP AND CULTURE
 Number of RD outputs in the last 3 years utilized by   3  3  Colleges,
 the industry or by other beneficiaries  7  7  Research  Ce
 Number of research outputs completed within the   Colleges,
 year  3  3  6  6  Research                                £      m i
 a.Percentage of research outputs  published (such
 as Elsevier Scopus, Thomson Reuters Journals,   3%  3%  Research, CAE
 and CHED accredited Journals                               £
 b. Number of research based paper published in
 CHED accredited iournals
 Percentage of graduate school faculty engaged in
 research work applied in any of the following:
 (a) Pursuing advanced research degree programs
 (PhD.)  5%  5%  9%  9%  CAE
 (b)  Actively publishing within the last (3) years
 (investigative research, basic and applied scientific  6%  6%  15%  15%  CAE  1
 (c) technologies for commercialization or livelihood
 improvement.  2%  2%  5%  5%  CAE                         J r   -
 (d)Whose research work resulted in an extension
 program  2%  2%  5%  5%  CAE        <«7n                   £
 Percentage increase in the percentage of graduate
 student population enrolled in research degree  100%  100%  100% 100%  CAE  U C - V %
 3- SUSTAINABLE EXTENSION AND COMMUNITY ENGAGEMENT
 Number of trainees weighted by the length of   Extension/
 training  1000  1000  1000 1000  2000  Colleaes  w         £
 Number of extension programs organized and
 supported consistent with the SUC's mandated and   1  1  1  1  Extension/  a
 priority programs  Colleges         i S                   s S    p lA - f   }   , !   } j
 Percentage of beneficiaries who rate the training
 course/s and advisory services as satisfactory or   100%  100%  100% 100%  Extension/  P -X   .   f:   '}'
 higher in terms of quality and relevance  Colleges  KXffc  (5*