
Page 246 - Proceeding of Atrans Young Researcher's Forum 2019_Neat
P. 246
“Transportation for A Better Life:
Smart Mobility for Now and Then”
23 August 2019, Bangkok, Thailand
The 60m right of way is well utilized in many parts. 1. Which mode did you use before BRTS
The NH 8 still has a large number of vehicles 2. Which mode do you use now?
moving through it. The signals are not pedestrian or 3. If shifted what is the reason?
bicycle prioritized. The crossing provisions for 4. If not shifted what is the reason?
pedestrians, like foot over bridge or subway are also 5. What are the issues being faces?
not provided in the mid-block sections. 6. Socio demographic status, like income, age,
vehicle ownership.
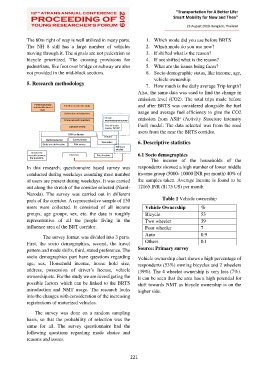
5. Research methodology 7. How much is the daily average Trip length?
Also, the same data was used to find the change in
emission level (CO2). The total trips made before
Preliminary study and after BRTS was considered alongside the fuel
and identification of Find the need for the study
topic usage and average fuel efficiency to give the CO2
Define aim and objectives
On site emission from ASIF (Activity Structure Intensity
Frame research questions reconnaissance survey
Questionnaire Fuel) model. The data selected was from the road
Literature review
survey SP , RP
users from the near the BRTS corridor.
DATA collection
Primary
Method selection Survey format
Secondary 6. Descriptive statistics
Study area delineation Pilot survey
Previous
studies
Check if the
research answers Inference Data Analysis 6.1 Socio demographics
the questions
The income of the households of the
In this research, questionnaire based survey was respondents showed a high number of lower middle
conducted during weekdays assuming most number income group (5000- 10000 INR per month) 40% of
of users are present during weekdays. It was carried the samples taken. Average income is found to be
out along the stretch of the corridor selected (Narol- 12165 INR ($175 US) per month
Naroda). The survey was carried out in different
parts of the corridor. A representative sample of 130 Table 1 Vehicle ownership
users were collected. It consisted of all income Vehicle Ownership %
groups, age groups, sex, etc. the data is roughly Bicycle 53
representative of all the people living in the Two wheeler 39
influence area of the BRT corridor. Four wheeler 7
Auto 0.9
The survey format was divided into 3 parts.
First, the socio demographics, second, the travel Others 0.1
pattern and mode shifts, third, stated preference. The Source: Primary survey
socio demographics part have questions regarding Vehicle ownership chart shows a high percentage of
age, sex, Household income, house hold size, respondents (53%) owning bicycles and 2 wheelers
address, possession of driver’s license, vehicle (39%). The 4 wheeler ownership is very less (7%).
ownership etc. For the study we are investigating the It can be seen that the area has a high potential for
possible factors which can be linked to the BRTS shift towards NMT as bicycle ownership is on the
introduction and NMT usage. The research looks higher side.
into the changes with consideration of the increasing
registrations of motorized vehicles.
The survey was done on a random sampling
basis, so that the probability of selection was the
same for all. The survey questionnaire had the
following questions regarding mode choice and
reasons and issues.
221