Page 247 - Proceeding of Atrans Young Researcher's Forum 2019_Neat
P. 247

“Transportation for A Better Life:
                                                                              Smart Mobility for Now and Then”

                                                                                    23 August 2019, Bangkok, Thailand

             6.2 Mode usage                                   6.4 Mode usage before and after BRTS

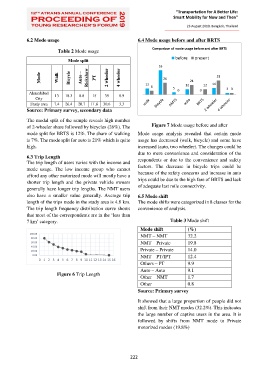
                           Table 2 Mode usage                        Comparison of mode usage before and after BRTS

                                                                               before   present
                               Mode split
                                                                       53
                   Mode    Walk   Bicycle   Auto –   Rickshaw      PT   2 wheeler   4 wheeler         26  21  31

                                                                  13
                                                                    8
                                                                              5    12      12  14     3 3
              Ahmedabad   13   18.3   8.8   15   35   8.9                       0         0
                 City
               Study area   7.4   26.4   20.7   11.6   30.6   3.3
             Source: Primary survey, secondary data

             The modal split of the sample reveals high number
             of 2-wheeler share followed by bicycles (26%). The     Figure 7 Mode usage before and after
             mode split for BRTS is 12%. The share of walking   Mode  usage  analysis  revealed  that  certain  mode
             is 7%. The mode split for auto is 21% which is quite   usage has decreased (walk, bicycle) and some have
             high.                                            increased (auto, two wheeler). The changes could be
                                                              due to mere convenience and consideration of the
             6.3 Trip Length
             The trip length of users varies with the income and   respondents  or  due  to  the  convenience  and  safety
             mode  usage.  The  low  income  group  who  cannot   factors.  The  decrease  in  bicycle  trips  could  be
             afford any other motorized mode will mostly have a   because of the safety concerns and increase in auto
             shorter  trip  length  and  the  private  vehicle  owners   trips could be due to the high fare of BRTS and lack
             generally have longer trip lengths. The NMT users   of adequate last mile connectivity.
             also  have  a  smaller  value  generally.  Average  trip   6.5 Mode shift
             length of the trips made in the study area is 4.8 km.   The mode shifts were categorized in 8 classes for the
             The trip length frequency distribution curve shows   convenience of analysis.
             that most of the correspondents are in the ‘less than
             7 km’ category.                                                 Table 3 Mode shift
                                                               Mode shift           (%)
              100.00                                           NMT – NMT            32.2
               80.00
               60.00                                           NMT – Private        19.8
               40.00
               20.00                                           Private – Private    14.0
               0.00                                            NMT – PT/IPT         12.4
                  0 1 2 3 4 5 6 7 8 9 10 11 12 13 14 15 16
                                                               Others – PT          9.9
                                                               Auto – Auto          9.1
                          Figure 6 Trip Length
                                                               Other – NMT          1.7
                                                               Other                0.8
                                                              Source: Primary survey

                                                              It showed that a large proportion of people did not
                                                              shift from their NMT modes (32.2%). This indicates
                                                              the large number of captive users in the area. It is
                                                              followed  by  shifts  from  NMT  mode  to  Private
                                                              motorized modes (19.8%)


                                                           222
   242   243   244   245   246   247   248   249   250   251   252