Page 250 - Proceeding of Atrans Young Researcher's Forum 2019_Neat
P. 250

“Transportation for A Better Life:
                                                                              Smart Mobility for Now and Then”

                                                                                    23 August 2019, Bangkok, Thailand

                                                              9.2 Carbon Dioxide emission
                                                              For  determining  the  suggestive  carbon  emission
                                                              levels  difference  before  and  after  BRTS  corridor
                                                              development, the trip lengths for each mode before
                                                              and  after  were  considered.  The  ASIF  (Activity
                                                              Structure Intensity Fuel) model was used to find the
                                                              CO2  emission  levels  considering  unchanged  trip
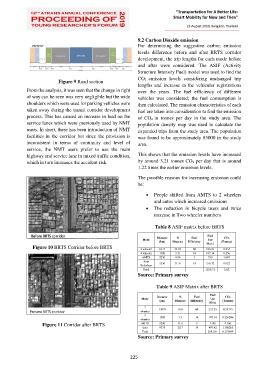
                           Figure 9 Road section
                                                              lengths  and  increase  in  the  vehicular  registrations
             From the analysis, it was seen that the change in right   over  the  years.  The  fuel  efficiency  of  different
             of way can be seen was very negligible but the wide   vehicles  was  considered;  the  fuel  consumption  is
             shoulders which were used for parking vehicles were   then calculated. The emission characteristics of each
             taken away during the transit corridor development   fuel are taken into consideration to find the emission
             process. This has caused an increase in load on the   of  CO2  in  tonnes  per  day  in  the  study  area.  The
             service lanes which were previously used by NMT   population  density  map  was  used  to  calculate  the
             users. In short, there has been introduction of NMT   expanded trips from the study area. The population
             facilities  in  the  corridor  but  since the provision is   was found to be approximately 85000 in the study
             inconsistent  in  terms  of  continuity  and  level  of   area.
             service,  the  NMT  users  prefer  to  use  the  main
             highway and service lane in mixed traffic condition,   This shows that the emission levels have increased
             which in turn increases the accident risk.       by around 3.21 tonnes CO2 per day that is around
                                                              1.22 times the earlier emission levels.

                                                              The possible reasons for increasing emission could
                                                              be:

                                                                    People  shifted  from  AMTS  to  2  wheelers
                                                                     and autos which increased emissions
                                                                    The  reduction  in  bicycle  users  and  twice
                                                                     increase in Two wheeler numbers

                                                                      Table 8 ASIF matrix before BRTS

                                                                                             Fuel
                                                                       Distance   %   Fuel
                                                                Mode                         Use    CO2
                                                                        (km)   Distance   Efficiency   (litre)   (Tonnes)
                Figure 10 BRTS Corridor before BRTS            2 wheeler   6375   14.05   60   106.25   0.254
                                                               4 wheeler   1500   3.31   14   107.14   0.256
                                                                AMTS    2250   4.96    3     750    1.689
                                                                 Auto
                                                               Rickshaw   5250   11.57   19   276.32   0.622
                                                                 Total                      1239.71   2.82
                                                              Source: Primary survey


                                                                      Table 9 ASIF Matrix after BRTS
                                                                                              Fuel
                                                                       Distance   %    Fuel
                                                                Mode                          Use    CO2
                                                                        (km)   Distance   Efficiency   (Tonnes)
                                                                                              (litre)
                                                                 2     13875    30.6    60    231.25   0.55315
                                                               wheeler
                                                                 4
                                                               wheeler   1500   3.3     14    107.14   0.256286
                    Figure 11 Corridor after BRTS               BRTS    5250    11.6    3     1750   4.186
                                                                Auto    9375    20.7    19    493.42   1.180263
                                                                Total                        2581.81   6.175699
                                                              Source: Primary survey


                                                           225
   245   246   247   248   249   250   251   252   253   254   255