
Page 255 - Proceeding of Atrans Young Researcher's Forum 2019_Neat
P. 255
“Transportation for A Better Life:
Smart Mobility for Now and Then”
23 August 2019, Bangkok, Thailand
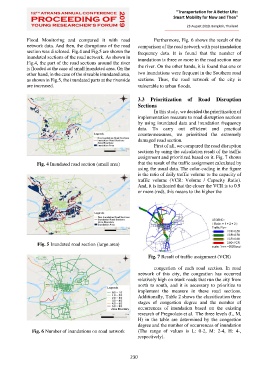
Flood Monitoring and compared it with road Furthermore, Fig. 6 shows the result of the
network data. And then, the disruptions of the road comparison of the road network with past inundation
section was disclosed. Fig.4 and Fig.5 are shown the frequency data. It is found that the number of
inundated sections of the road network. As shown in inundations is three or more in the road section near
Fig.4, the part of the road sections around the river
is flooded at the case of small inundated area. On the the river. On the other hands, it is found that one or
other hand, in the case of the sizeable inundated area, two inundations were frequent in the Southern road
as shown in Fig.5, the inundated parts at the riverside sections. Thus, the road network of the city is
are increased. vulnerable to urban floods.
3.3 Prioritization of Road Disruption
Sections
In this study, we decided the prioritization of
implementation measure to road disruption sections
by using inundated data and inundation frequency
data. To carry out efficient and practical
countermeasures, we prioritized the extremely
damaged road section.
First of all, we compared the road disruption
sections by using the calculation result of the traffic
assignment and prioritized based on it. Fig. 7 shows
Fig. 4 Inundated road section (small area) that the result of the traffic assignment calculated by
using the usual data. The color-coding in the figure
is the ratio of daily traffic volume to the capacity of
traffic volume (VCR: Volume / Capacity Ratio).
And, it is indicated that the closer the VCR is to 0.9
or more (red), this means to the higher the
Fig. 5 Inundated road section (large area)
Fig. 7 Result of traffic assignment (VCR)
congestion of each road section. In road
network of this city, the congestion has occurred
relatively high on trunk roads that run the city from
north to south, and it is necessary to prioritize to
implement the measure in these road sections.
Additionally, Table 2 shows the classification three
stages of congestion degree and the number of
occurrences of inundation based on the existing
research of Pregnolato et al. The three levels (L, M,
H) in the table are determined by the congestion
degree and the number of occurrences of inundation
Fig. 6 Number of inundations on road network (The range of values is L: 0-2, M: 2-4, H: 4-,
respectively).
230