
Page 66 - Proceeding of Atrans Young Researcher's Forum 2019_Neat
P. 66
“Transportation for A Better Life:
Smart Mobility for Now and Then”
23 August 2019, Bangkok, Thailand
As for the principles to create a rule-based made up the largest percentage in the mode share
model, first it should cover at least 50% of data of whilst bike had to scarified its number of correct
th
each input feature (i.e. 95 percentile and median classification to limit the misclassification of others
th
speed) for each mode. For example, 95 percentile as it.
of speed of walk should be over its median level of The greatest confusion can be seen between
1.76 m/s whilst median speed should be over 1.05 motorized and bike. 42% of bike segments were
m/s (see Table 1). Second, rules have to produce the misclassified as motorized ones. This is quite strange
recall of every class over 50%. Additionally, if there in comparison with findings in the literature where
was an overlap between modes, a priority was given the most serious confusion is between car and
to the mode with larger percentage in the sample. bus/tram [12] and good performances of classifying
between motorized and non-motorized modes [18],
Table 1 Statistics of speed profiles by modes [25], [26]. There may be two reasons. First, traffic in
Percentile Walk Bike Motorized Hanoi is mixed and congestion fairly frequently
3
th
95 percentile of speed (m/s) takes place at some areas, leading speed of
th
5 1.01 3.97 4.80 motorized means and bike to be close together. On
th
25 1.37 4.35 7.23 the other hand, travel of Hanoi citizens depends
th
50 1.76 5.66 8.97 heavily upon motorcycle that is not a significant
th
75 2.59 7.07 11.60 mode in developed countries, thus not included in
th
85 3.46 7.52 13.73 mode detection list. As described in Figure 5 and
Median speed (m/s) Figure 7, motorcycle showed speed levels akin to
th
5 0.55 2.01 2.51 those of bike; therefore, it took main responsibility
th
25 0.84 2.90 4.16 for overlaps between bike and motorized segments.
th
50 1.05 3.30 5.48
th
75 1.34 3.90 7.28
th
85 1.63 4.67 8.80
Based on mentioned-above analyses, rules
were proposed as follows:
th
- If a segment has 95 percentile of speed
smaller than 3.5 m/s and median speed smaller than
2 m/s, it will be labeled walk.
th
- If a segment has 95 percentile of speed
smaller than 6 m/s and median speed smaller than 4
m/s and is not walk, it will be labeled bike.
- The remainder of segments will be
motorized.
Python programming language was used to
analyze data.
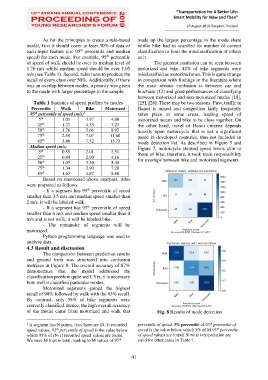
4.3 Result and discussion
The comparison between prediction results
and ground truth was structured into confusion
matrixes in Figure 8. The overall accuracy of 87%
demonstrates that the model addressed the
classification problem quite well. Yet, it is necessary
how well it classified particular modes.
Motorized segments gained the highest
recall of 90% followed by walk with the 83% recall.
By contrast, only 58% of bike segments were
correctly classified. Hence, the high overall accuracy
of the model came from motorized and walk that Fig. 8 Results of mode detection
th
3 A segment has N points, thus there are (N-1) recorded percentile of speed. 5% percentile of 95 percentile of
th
th
speed values. 95 percentile of speed is the value below speed is the value below which 5% of M 95 percentile
which 95% of (N-1) recorded speed values are found. of speed values are found. Similar interpretation are
We have M trips in total, leading to M values of 95 valid for other cases in Table 1.
th
41