
Page 42 - OF0620 Online_Neat
P. 42
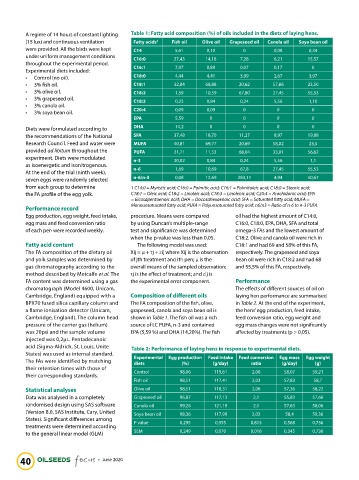
A regime of 14 hours of constant lighting   Table 1: Fatty acid composition (%) of oils included in the diets of laying hens.
          (15 lux) and continuous ventilation   Fatty acids   1  Fish oil  Olive oil  Grapeseed oil  Canola oil  Soya bean oil
          were provided. All the birds were kept   C14     5,61       0,10        0         0,08       0,34
          under uniform management conditions   C16:0      27,43     14,18       7,28       6,21       15,57
          throughout the experimental period.
          Experimental diets included:       C16:1         7,97       0,89       0,07       0,17        0
          •   Control (no oil).              C18:0         4,44       4,41       3,99       2,67       3,97
          •   3% fish oil.                   C18:1         32,84     68,88      20,62      57,86       23,50
          •   3% olive oil.                  C18:2         1,59      10,59      67,80      27,45       55,53
          •   3% grapeseed oil.              C18:3         0,23       0,84       0,24       5,56       1,10
          •   3% canola oil.
          •   3% soya bean oil.              C20:4         0,09       0,09        0          0          0
                                             EPA           5,59        0          0          0          0
          Diets were formulated according to   DHA         14,2        0          0          0          0
          the recommendations of the National   SFA        37,48     18,70      11,27       8,97       19,88
          Research Council. Feed and water were   MUFA     40,81     69,77      20,69      58,02       23,5
          provided ad libitum throughout the   PUFA        21,71     11,53      68,04      33,01       56,62
          experiment. Diets were modulated   n-3           20,02      0,84       0,24       5,56        1,1
          as isoenergetic and isonitrogenous.
          At the end of the trial (ninth week),   n-6      1,69      10,69       67,8      27,45       55,53
          seven eggs were randomly selected   n-6/n-3      0,08      12,69      283,11      4,94       50,67
          from each group to determine      1 C14:0 = Myristic acid; C16:0 = Palmitic acid; C16:1 = Palmitoleic acid; C18:0 = Stearic acid;
          the FA profile of the egg yolk.   C18:1 = Oleic acid; C18:2 = Linoleic acid; C18:3 = Linolenic acid; C20:4 = Arachidonic acid; EPA
                                            = Eicosapentaenoic acid; DHA = Docosahexaenoic acid; SFA = Saturated fatty acid; MUFA =
          Performance record                Monounsaturated fatty acid; PUFA = Polyunsaturated fatty acid; n6/n3 = Ratio of n-6 to n-3 PUFA.
          Egg production, egg weight, feed intake,   procedure. Means were compared   oil had the highest amount of C14:0,
          egg mass and feed conversion ratio   by using Duncan’s multiple-range   C16:0, C18:0, EPA, DHA, SFA and total
          of each pen were recorded weekly.  test and significance was determined   omega-3 FAs and the lowest amount of
                                            when the p-value was less than 0,05.  C18:2. Olive and canola oil were rich in
          Fatty acid content                   The following model was used:    C18:1 and had 69 and 58% of this FA,
          The FA composition of the dietary oil   Xij = µ + τj + ɛij where Xij is the observation   respectively. The grapeseed and soya
          and yolk samples was determined by   of jth treatment and ith pen; µ is the   bean oil were rich in C18:2 and had 68
          gas chromatography according to the   overall means of the sampled observation;   and 55,5% of this FA, respectively.
          method described by Metcalfe et al. The   τj is the effect of treatment; and ɛij is
          FA content was determined using a gas   the experimental error component.  Performance
          chromatograph (Model 4600, Unicam,                                   The effects of different sources of oil on
          Cambridge, England) equipped with a   Composition of different oils  laying hen performance are summarised
          BPX70 fused silica capillary column and   The FA composition of the fish, olive,   in Table 2. At the end of the experiment,
          a flame ionisation detector (Unicam,   grapeseed, canola and soya bean oil is   the hens’ egg production, feed intake,
          Cambridge, England). The column head   shown in Table 1. The fish oil was a rich   feed conversion ratio, egg weight and
          pressure of the carrier gas (helium)   source of LC PUFA, n-3 and contained   egg mass changes were not significantly
          was 20psi and the sample volume   EPA (5,59 %) and DHA (14,20%). The fish   affected by treatments (p > 0,05).
          injected was 0,2µL. Pentadecanoic
          acid (Sigma-Aldrich, St. Louis, Unite   Table 2: Performance of laying hens in response to experimental diets.
          States) was used as internal standard.
          The FAs were identified by matching   Experimental  Egg production   Feed intake  Feed conversion  Egg mass   Egg weight
                                                                                    ratio
                                                                        (g/day)
                                                             (%)
                                             diets
                                                                                                         (g)
                                                                                               (g/day)
          their retention times with those of
          their corresponding standards.     Control         98,06      119,61       2,06      58,07     59,21
                                             Fish oil        98,51      117,41       2,03      57,83     58,7
          Statistical analyses               Olive oil       98,51      118,31       2,06      57,36     58,22
          Data was analysed in a completely   Grapeseed oil  96,87      117,13       2,1       55,83     57,66
          randomised design using SAS software   Canola oil  99,26      121,19       2,1       57,63     58,06
          (Version 8.0, SAS Institute, Cary, United   Soya bean oil  98,36  117,99   2,02       58,4     59,36
          States). Significant differences among
          treatments were determined according   P value     0,295      0,955       0,813      0,568     0,736
          to the general linear model (GLM)   SEM            0,249      0,970       0,016      0,345     0,736


        40                         June 2020