
Page 65 - Technology Roadmap Transportation
P. 65
TECHNOLOGY ROADMAP: TRANSPORTATION
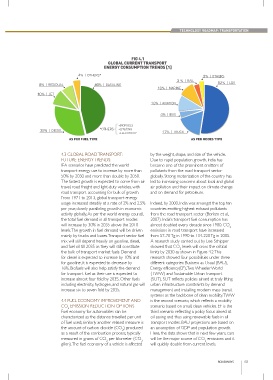
FIG 4.1
GLOBAL CURRENT TRANSPORT
ENERGY CONSUMPTION TRENDS [1]
4% | OTHERS* 3% | OTHERS
3 % | RAIL
8% | RESIDUAL 46% | GASOLINE 52% | LDV
10% | MARINE
10% | JET
10% | AVIATION
4% | BUS
{ +BIOFUELS
32% | DIESEL *OTHERS +LPG/CNG 17% | TRUCK
+ELECTRICITY
AS PER FUEL TYPE AS PER MODES TYPE
4.3 GLOBAL ROAD TRANSPORT: by the weight, shape, and size of the vehicle.
FUTURE ENERGY TRENDS: Due to rapid population growth, India has
IEA scenarios have predicted the world become one of the prominent emitters of
transport energy use to increase by more than pollutants from the road transport sector
50% by 2030 and more than double by 2050. globally. Strong motorization of the country has
The fastest growth is expected to come from air led to increasing concerns about local and global
travel, road freight and light-duty vehicles, with air pollution and their impact on climate change
road transport accounting for bulk of growth. and on demand for petroleum.
From 1971 to 2013, global transport energy
usage increased steadily at a rate of 2% and 2.5% Indeed, by 2000, India was amongst the top ten
per year, closely paralleling growth in economic countries emitting highest exhaust pollutants
activity globally. As per the world energy council, from the road transport sector (Borken et al.,
the total fuel demand in all transport modes 2007). India’s transport fuel consumption has
will increase by 30% in 2035 above the 2010 almost doubled every decade since 1980. CO
2
levels. The growth in fuel demand will be driven emissions in road transport have increased
mainly by trucks and buses. Transport sector fuel from 57-70 Tg in 1990 to 134-220 Tg in 2005.
mix will still depend heavily on gasoline, diesel, A research study carried out by Lee Schipper
and fuel oil till 2035 as they will still constitute showed that CO levels will cross the critical
2
the bulk of transport market fuels. Demand limits by 2030 as shown in Figure 4.2 This
for diesel is expected to increase by 10% and research showed four possibilities under three
for gasoline, it is expected to decrease by different categories: Business as Usual (BAU),
16%. Biofuels will also help satisfy the demand Energy efficiency(EF), Two Wheeler World
for transport fuel as their use is expected to (TWW) and Sustainable Urban Transport
increase almost four fold by 2035. Other fuels (SUT). SUT reflects policies aimed at truly lifting
including electricity, hydrogen, and natural gas will urban infrastructure constraints by demand
increase six to seven fold by 2035. management and installing modern mass transit
systems as the backbone of clean mobility. TWW
4.4 FUEL ECONOMY IMPROVEMENT AND is the second scenario, which reflects a mobility
CO EMISSION REDUCTION OPTIONS scenario based on small, clean vehicles. EF is the
2
Fuel economy for automobiles can be third scenario reflecting a policy focus aimed at
characterized as the distance travelled per unit oil saving and thus using renewable fuels in all
of fuel used; similarly another related measure is transport modes. BAU projections are based on
the amount of carbon dioxide (CO ) produced an assumption of GDP and population growth.
2
as a result of the combustion process, typically Here, the data shows that in next few years, cars
measured in grams of CO per kilometer (CO will be the major source of CO emissions and it
2
2
2
g/km). The fuel economy of a vehicle is affected will quickly double from current levels.
ROADWAYS 63