
Page 100 - Science
P. 100
RESEARCH | REPORT
1.0 empirically fit mortality and susceptibility func-
No immunity
Incomplete immunity tions (equations S2 and table S3) and compared
this incomplete immunity model with one that
0.8 still allows for higher host mortality and trans-
Invasion success 0.6 not include immune protection from prior expo-
mission for higher-virulence strains (15) but does
sure. We applied an adaptive dynamics approach
0.4
by simulating the invasion of a new mutant into
strain for a range of virulence levels of both the
0.2 apopulationwith anendemic resident pathogen
resident and invading strains (see supplementary
0.0 materials). In the resulting pairwise invasibility
plots (PIPs), the protective effects of host immu-
1 2 3 4 5 nity shifted the pathogen’sevolutionarilystable
strategy to a virulence level almost twice as high
Invading strain virulence ε 2
as that in a model with no host protection (Fig. 3).
This result, which is robust even when additional
5
5
protective effects of strain homology are added
Invading strain virulence ε 2 4 3 2 * 4 3 2 * mechanisms favoring greater virulence. First,
to the model (fig. S3), is driven by two distinct
because disease-induced mortality is a key cost
of virulence, higher-virulence strains benefit
the most from the reduction in host mortality
(Fig. 2A) generated by incomplete immune pro-
tection. Second, the stronger protection provided
by higher-virulence strains reduces the pool of
1
1
previously infected hosts available for reinfec- Downloaded from
1 2 3 4 5 1 2 3 4 5 tion by lower-virulence strains (Fig. 2B). We eval-
Resident strain virulence ε 1 Resident strain virulence ε 1 uated the general applicability of our two-strain
model to other study systems by conducting a
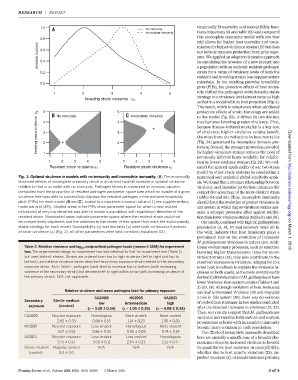
Fig. 3. Optimal virulence in models with no immunity and incomplete immunity. (A) The empirically numerical and analytical global sensitivity analy-
observed effects of incomplete immunity result in an almost twofold increase in optimal virulence sis. We found that a stronger relationship between
relative to that in a model with no immunity. Pathogen fitness is measured as invasion success, virulence and immune protection enhances the
computed from the proportion of resident pathogen parameter space over which an invader of a given competitive advantage of the more-virulent strain http://science.sciencemag.org/
virulence level was able to successfully displace the resident pathogen in the pairwise invasibility (tables S4 and S5). Thus, incomplete immunity
plots (PIPs) for each model (B and C), scaled to a maximum invasion value of 1 [see supplementary should favor the evolution of greater virulence in
materials and (35)]. Shaded areas in the PIPs show parameter space for which a new mutant any system in which higher-virulence strains gen-
introduced at very low densities was able to invade a population with equilibrium densities of the erate a stronger protective effect against reinfec-
resident strain. Nonshaded areas indicate parameter space where the resident strain could not tion than lower-virulence strains (tables S4 and S5).
be competitively displaced, and the asterisks in the center of this space thus mark the evolutionarily Ourresults,combinedwithhighM.gallisepticum
stable strategy for each model. Susceptibility (h) and mortality (u) were both continuous functions prevalence (8, 16, 17) and recovery rates (6)in
of strain virulence (e) (Fig. 2); all other parameters were held constant (equations S2). the wild, indicate that host immunity plays a on March 1, 2018
prominent role in the evolution of increased
M. gallisepticum virulence in nature (10). Addi-
Table 2. Relative virulence and log 10 conjunctival pathogen loads (means ± SEM) for experiment tional evolutionary processes, such as selection
two.The experimental design for experiment two was identical to that for experiment one (Table 1) favoring higher transmission rates for more-
but used distinct strains. Strains are ordered from low to high virulence (left to right and top to virulent strains (15), may also contribute to the
bottom), and relative virulence terms describe the primary exposure strain relative to the secondary observed increases in virulence. Adaptation to a
exposure strain. As in Table 1, pathogen loads tend to increase top to bottom (with increasing novel host is unlikely to explain the virulence in-
virulence of the secondary strain) but decrease left to right within a row (with increasing virulence of creases on both coasts, as the more evolutionarily
the primary strain). N/A, not applicable. derived California strains of M. gallisepticum have
lower virulence than eastern strains (Tables 1 and
2) (10, 18). Although evolution of host resistance
Relative virulence and mean pathogen load for primary exposure can lead to increased virulence (19)and mayplay
CA2009 NC1995 VA2013 arole inthis system(20), there was no evidence
Secondary Sterile medium low intermediate high of evolvedhost resistance intwostudies conducted
exposure (control)
(e = 1.28 ± 0.34) (e = 1.95 ± 0.35) (e = 4.08 ± 0.34) after the detected increases in virulence (21, 22).
Thus, our results suggest that M. gallisepticum
CA2009 No prior exposure Homologous More virulent More virulent virulence increased in both eastern and western
2.82 ± 0.33 0.68 ± 0.16 1.14 ± 0.23 1.05 ± 0.20
.......................................................................................................................................................................................................................... populations as hosts with incomplete immunity
NC1995 No prior exposure Less virulent Homologous More virulent became more common in each population.
3.67 ± 0.91 0.86 ± 0.33 0.56 ± 0.08 0.74 ± 0.14
.......................................................................................................................................................................................................................... The effects of incomplete immunity described
VA2013 No prior exposure Less virulent Less virulent Homologous here are arguably a specific case of a broader phe-
3.75 ± 0.37 3.00 ± 0.11 2.64 ± 0.23 1.51 ± 0.47 nomenon whereby increased virulence is favored
..........................................................................................................................................................................................................................
Sterile medium Negative control N/A N/A N/A by quantitative host variation in susceptibility,
(control) 0.0 ± 0.0 whether due to host genetic variation (23), im-
..........................................................................................................................................................................................................................
perfect vaccines (5), or innate immune priming
Fleming-Davies et al., Science 359, 1030–1033 (2018) 2 March 2018 3of 4