
Page 99 - Science
P. 99
RESEARCH | REPORT
from the disease-induced mortality that prevents supplementary materials). Disease-induced mor- treatment groups. Thus, by generating stron-
onward pathogen transmission and thus reduces tality rates were inferred to scale linearly with ger host protection during primary infection
pathogen fitness to zero. Second, we observed conjunctivitis severity, which predicts mortality (Fig. 1), high-virulence strains effectively exclude
the greatest reduction in pathogen load and clin- risk in the wild (7); susceptibility to infection was low-virulence strains from future infections of
ical signs and, thus, the strongest protection inferred from the presence of a pathogen load that host.
2
against reinfection in hosts previously exposed to above 10 copies in the conjunctiva at any post- We next asked how the observed relationship
higher-virulence strains (Fig. 1 and Tables 1 and inoculation qPCR sampling point. As expected, between virulence and protection against re-
2). Primary exposure to a homologous strain also disease-induced mortality and susceptibility in- infection alters the optimal or evolutionarily
generated strong host protection (Fig. 1), suggest- creased with the virulence of the currently infecting stable level of virulence in a pathogen population
ing that adaptive immune responses, either alone strain (Fig. 2 and tables S1 and S2). Thus, virulent (Fig. 3). We used a two-strain SIRS (susceptible-
or in combination with innate priming mecha- strains are better able to successfully infect hosts infected-recovered-susceptible) model with the
nisms (14), likely underlie the detected incom- but also cause higher disease-induced mortality
plete protection against reinfection (see also than less virulent strains. However, the host im- 0.15
fig. S1). mune status generated by primary treatment
We used the empirical responses to secondary strongly modifies the degree of disease-induced
inoculation to fit two key pathogen-associated mortality and susceptibility for all strains. Hosts (days −1 ) 0.10
traits, disease-induced mortality and suscepti- with prior exposure to high-virulence strains
Mortality rate ν 0.05
bility, as continuous functions of the virulence (Fig. 2, red lines) had the lowest disease-induced
of both the primary and secondary strains (see mortality and susceptibility among all primary
6
0.00
Increasing immune protection Maximum total lesion score per individual 5 4 3 2 η Susceptibility 1.0 1 2 3 Primary exposure: 5 Downloaded from
4
0.8
0.6
Low virulence strain
Mid virulence strain
0.2
High virulence strain
0 1 0.4 No previous exposure http://science.sciencemag.org/
0.0
No previous Lower virulence Homologous Higher virulence Negative control
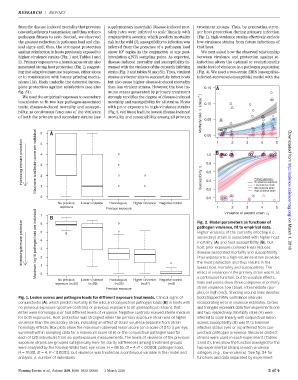
exposure Previous exposure Fig. 2. Model parameters as functions of 5
4
3
1
2
Virulence of second strain ε 2
7
Increasing immune protection Maximum log10 pathogen load per individual 5 4 3 2 pathogen virulence, fit to empirical data. on March 1, 2018
6
Higher virulence of the currently infecting (i.e.,
secondary) strain is associated with higher host
mortality (A) and host susceptibility (B), but
host prior exposure (colored lines) reduces
disease-associated mortality and susceptibility.
Prior exposure to a high-virulence strain provides
1
lowest host mortality and susceptibility.The
effect of virulence of the primary strain was fit as
0
a continuous function, but to visualize effects,
No previous Lower virulence Homologous Higher virulence Negative control the most protection and thus results in the
exposure (n=30) (n=29) (n=25) (n=27) (n=9) lines and points show three categories of primary
strain virulence: low (blue), intermediate (pur-
Previous exposure
ple), or high (red). Shading around lines denotes
Fig. 1. Lesion scores and pathogen loads for different exposure treatments. Clinical signs of bootstrapped 95% confidence intervals
conjunctivitis (A), which predict mortality in the wild, and conjunctival pathogen loads (B) in hosts with incorporating error in virulence estimates. Circles
no previous exposure (positive controls) or previous exposure to M. gallisepticum strains that and triangles represent data from experiments one
either were homologous or had different levels of virulence. Negative controls received sterile medium and two, respectively. Mortality rates (A) were
for both exposures. Host protection was strongest when the primary exposure strain was of higher inferred to scale linearly with conjunctival lesion
virulence than the secondary strain, indicating an effect of strain virulence separate from strain scores; susceptibility (B) was fit to binomial
homology effects. Box plots show the maximum observed lesion score (on a scale of 0 to 3 per eye, infection status (yes or no) inferred from con-
summed within sampling data for a maximum score of 6) or the conjunctival pathogen load for junctival pathogen presence. Because distinct
each of 120 individuals from six postexposure measurements. The levels of virulence of the previous- strains were used in each experiment (Tables
exposure strains are grouped categorically here for clarity (differences among treatment groups 1 and 2), lines show the function averaged for the
were analyzed by the Kruskal-Wallis test; eye score, H = 68.16, df = 4, P < 0.0001; pathogen load, two experimental strains in each virulence
H = 76.80, df = 4, P < 0.0001), but virulence was treated as a continuous variable in the model and category (e.g., low virulence). See fig. S4 for
analysis. n, number of individuals. functions and data separated by experiment.
Fleming-Davies et al., Science 359, 1030–1033 (2018) 2 March 2018 2of4