
Page 108 - Science
P. 108
RESEARCH | REPORT
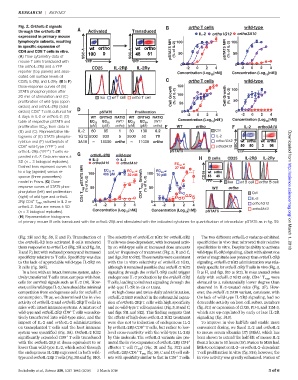
Fig. 2. OrthoIL-2 signals ortho T cells wild-type
through the orthoIL-2R Activated Transduced IL-2 ortho1G12 ortho3A10
expressed in primary mouse
lymphocyte subsets, resulting 100 100
in specific expansion of
CD4 and CD8 Tcells in vitro. SSC-A SSC-A pSTAT5 MFI (% of IL-2) 50 pSTAT5 MFI (% of IL-2) 50
(A) Flow cytometry data of
mouse T cells transduced with YFP YFP
0 0
the orthoIL-2Rb and a YFP CD25 IL-2R IL-2R -2 0 2 4 -2 0 2 4
reporter (top panels) and asso- Concentration (Log [nM]) Concentration (Log [nM])
ciated cell surface levels of 10 10
CD25, IL-2Rb,and IL-2Rg.(B to F) ortho T cells wild-type
Dose-response curves of (B) 150
STAT5 phosphorylation after 100
20 min of stimulation and (C) Iso wt T cell ortho T cell Cell Growth (% of IL-2) 100 Cell Growth (% of IL-2)
proliferation of wild-type (open 50 50
circles) and orthoIL-2Rb (solid
+
circles) CD8 Tcells cultured for pSTAT5 Proliferation 0 0
4days inIL-2or orthoIL-2; (D) WT ORTHO RATIO WT ORTHO RATIO -2 0 2 4 -2 0 2 4
10
10
table of respective pSTAT5 and EC 50 EC 50 (WT/ EC 50 EC 50 (WT/ Concentration (Log [nM]) Concentration (Log [nM])
proliferation EC 50 from data in (pM) (pM) ortho) (pM) (pM) ortho) WT ortho IL-2 ortho3A10
(B) and (C). Representative his- IL-2 80 85 1 30 130 0.2 Ctrl
tograms of (E) STAT5 phospho- 1G12 5000 930 5 3500 50 70 IL-2
rylation and (F) scatterplots of 3A10 18000 ortho 11000 ortho ortho1G12 SSC-A
–
+
CD8 wild-type (YFP ) and ortho3A10 Downloaded from
+
orthoIL-2Rb (YFP ) T cells ex- pSTAT5 YFP
orthoIL-2R wild-type
panded in IL-2. Data are means ± B cells CD25 IL-2R IL-2R
IL-2 IL-2
SD (n = 3 biological replicates). ortho3A10 ortho3A10 EC 50
Dashed lines represent curves fit 27 nM
EC 50
to a log (agonist) versus re- 100 400 pM EC 50 100 EC 50
sponse (three parameters) 32 nM 70 pM CD19
model in Prism. (G)Dose- CD4 T reg pSTAT5 MFI (% of IL-2) CD4 T reg Growth (% of IL-2) YFP Iso wt B cell ortho B cell
response curves of STAT5 phos- 50 50 WT ortho
phorylation (left) and proliferation i i Ctrl http://science.sciencemag.org/
(right) of wild-type and orthoIL- IL-2
+
2Rb CD4 T regs cultured in IL-2 or 0 0 ortho1G12
-4 -2 0 2 4 -4 -2 0 2 4
orthoIL-2. Data are means ± SD
Concentration (Log [nM]) Concentration (Log [nM]) ortho3A10
(n = 3 biological replicates). 10 10 pSTAT5
(H) Representative histograms
of primary mouse B cells transduced with the orthoIL-2Rb and stimulated with the indicated cytokines for quantification of intracellular pSTAT5 as in fig. S9.
(Fig. 2H and fig. S9, E and F). Transduction of The selectivity of orthoIL-2 1G12 for orthoIL-2Rb The two different orthoIL-2 variants exhibited on March 1, 2018
the orthoIL-Rb into activated B cells rendered T cells was dose-dependent, with increased activ- specificities in vivo that mirrored their relative
them responsive to orthoIL-2 (Fig. 2H and fig. S9, ity on wild-type cells at increased dose amounts specificities in vitro. Despite its ability to activate
E and F), but with reduced potency and increased and/or frequency of treatment (Fig. 3, B and C, wild-type IL-2Rb signaling, albeit with about one
specificity relative to T cells. Specificity was due and figs. S10 to S12). These results were consistent order of magnitude less potency than orthoIL-2Rb
to the lack of appreciable wild-type IL-2Rb on with the in vitro selectivity of orthoIL-2 1G12, signaling, orthoIL-2 1G12 administration was rela-
B cells (fig. S9E). although it remained possible that orthoIL-2 1G12 tively specific for orthoIL-2Rb T cells in vivo (Fig. 3,
In a hostwith anintactimmune system,adop- signaling through the orthoIL-2Rb could trigger B to H, and figs. S10 to S12). In mice treated twice
+
tively transferred T cells must compete with host endogenous IL-2 production by the orthoIL-2Rb daily with orthoIL-2 1G12 only, CD4 T regs were
cells for survival signals such as IL-2 (16). How- T cells, leading to indirect signaling through the elevated to a substantially lower degree than
ever,unlikewild-typeIL-2, thereshouldbeminimal wild-type IL-2R in cis or trans. observed in IL-2–treated mice (Fig. 3F). How-
competition from endogenous cells for orthoIL-2 At high doses and twice-daily administration, ever, the orthoIL-2 3A10 variant, consistent with
consumption. Thus, we determined the in vivo orthoIL-2 3A10 resulted in the substantial expan- the lack of wild-type IL-2Rb signaling, had no
activity of orthoIL-2 and orthoIL-2Rb T cells in sion of orthoIL-2Rb T cells with high specificity detectable activity on host cell subset numbers
mice with intact immune systems. A mixture of and no wild-type T cell expansion (Fig. 3, B and C, (fig. S11) or expression of CD25, PD-1, and TIM-3,
+
wild-type and orthoIL-2Rb CD8 Tcells was adop- and figs. S11 and S12). This finding suggests that which are up-regulated by early or late IL-2R
tively transferred into wild-type mice, and the the effects of high-dose orthoIL-2 1G12 treatment signaling (fig. S13).
impact of IL-2 and orthoIL-2 administration were due not to induction of endogenous IL-2 To improve in vivo half-life and enable more
+
on transplanted T cells and the host immune by orthoIL-2Rb CD8 T cells, but rather to low- convenient dosing, we fused IL-2 and orthoIL-2
system was quantified (Fig. 3A). OrthoIL-2 1G12 level cross-reactivity with the wild-type IL-2Rb to mouse serum albumin (17)(MSA),which has
+
significantly expanded CD8 T cells transduced by this molecule. The orthoIL-2 variants also pro- been shown to extend the half-life of mouse IL-2
with the orthoIL-2Rb at doses equivalent to or moted the in vivo expansion of orthoIL-2Rb CD4 + from 5 hours to 50 hours (18). Fusion to MSA had
lower than wild-type IL-2, which acted through effector T cell (T eff ) (Fig. 3I and fig. S12) and littleto no impact onIL-2–ororthoIL-2–dependent
+
the endogenous IL-2Rb expressed in both wild- orthoIL-2Rb CD4 T reg (fig. S9, C and D) cell sub- T cell proliferation in vitro (fig. S14); however, the
+
type and orthoIL-2Rb T cells (Fig. 3B and fig. S10). sets with specificity similar to that in CD8 T cells. in vivo activity was greatly enhanced. Fusion of
Sockolosky et al., Science 359, 1037–1042 (2018) 2 March 2018 3of 6