
Page 113 - Science
P. 113
RESEARCH | REPORT
at ~9 pN (80.1% of the recorded unfolding traces and fig. S5), the two refolding step sizes were (I), and an unfolded state (U) (fig. S9). During
had one-step unfolding transitions, and 84.6% very similar (fig. S8). This unfolding and refold- unfolding at high force, only the barrier be-
of the refolding transitions had two steps) (Fig. ing asymmetry is consistent with a three-state tween the native and intermediate states is ob-
2C and figs. S6 and S7). Consistent with the in- free-energy landscape: the native state (N), an served, whereas at the lower forces at which
ternal symmetry of the single-chain design (Fig. 2A intermediate state containing only one hairpin refolding occurs, both energy barriers become Downloaded from
on March 1, 2018
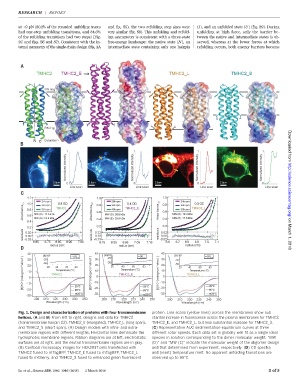
Fig. 1. Design and characterization of proteins with four transmembrane protein. Line scans (yellow lines) across the membranes show sub- http://science.sciencemag.org/
helices. (A and B) From left to right, designs and data for TMHC2 stantial increase in fluorescence across the plasma membranes for TMHC2,
(transmembrane hairpin C2), TMHC2_E (elongated), TMHC2_L (long span), TMHC2_E, and TMHC2_L, but less substantial increase for TMHC2_S.
and TMHC2_S (short span). (A) Design models with intra- and extra- (C) Representative AUC sedimentation-equilibrium curves at three
membrane regions with different lengths. Horizontal lines demarcate the different rotor speeds. Each data set is globally well fit as a single ideal
hydrophobic membrane regions. Ribbon diagrams are at left, electrostatic species in solution corresponding to the dimer molecular weight. “MW
surfaces are at right, and the neutral transmembrane regions are in gray. (D)” and “MW (E)” indicate the molecular weight of the oligomer design
(B) Confocal microscopy images for HEK293T cells transfected with and that determined from experiment, respectively. (D)CD spectra
TMHC2 fused to mTagBFP, TMHC2_E fused to mTagBFP, TMHC2_L and (inset) temperature melt. No apparent unfolding transitions are
fused to mCherry, and TMHC2_S fused to enhanced green fluorescent observed up to 95°C.
Lu et al., Science 359, 1042–1046 (2018) 2 March 2018 2of5