
Page 118 - Science
P. 118
RESEARCH | REPORT
pH 5 HOAc
pH 5 pH 5 HOAc pH 5.5 7.4
OTOP1 +
1.6 sham **** pH5 NMDG
1.6
1.4
F/F o 1.4
1.2 F/F o 1.2
1.0 1.0 50 pA
0 200 400 600 sham OTOP1 sham OTOP1 Na + Li + Cs + Ca 2+ 4s
Time (s)
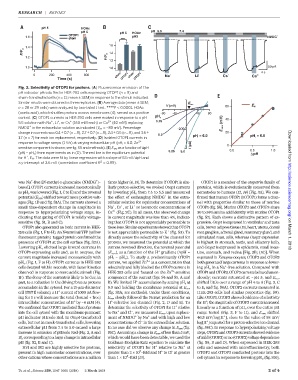
Fig. 2. Selectivity of OTOP1 for protons. (A) Fluorescence emission of the
pH indicator pHrodo Red in HEK-293 cells expressing OTOP1 (n =9)and
sham-transfected cells (n = 11; mean ± SEM) in response to the stimuli indicated.
Similar results were obtained in three replicates. (B)Average data (mean ± SEM; E rev
V (mV) 60 E H
n = 28 or 29 cells) were analyzed by two-tailed t test. ****P< 0.0001. HOAc
(acetic acid), which shuttles protons across membranes (4), served as a positive -80 -40 40 80
control. (C) OTOP1 currents in HEK-293 cells were evoked in response to a pH pH o (mV) 40
+
+
+
5.5 solution with Na ,Li ,or Cs (160 mM each) or Ca 2+ (40 mM) replacing 5.75
+
NMDG in the extracellular solution as indicated (V m = –80 mV). Percentage -200 E rev
change in currents was 0.4 ± 0.7 (n =8), 2.7±0.7(n =8), 2.4 ± 0.5 (n =8), and3.6 ± 20
5.5 pH = 6.0 pH = 6.0
1.7 (n = 7) for each ion replacement, respectively. (D) Isolated OTOP1 currents in i i
2+
response to voltage ramps (1 V/s) at varying extracellular pH (pH i =6.0;Zn - (pA) 0
sensitive component is shown; seefig.S5 and methods). (E) E rev as a functionofDpH I Downloaded from
5.25 5.0 0.0 0.5 1.0
(pH i – pH o ) from experiments as in (D).The red line is the equilibrium potential Δ pH
+
for H , E H .The data were fit by linear regression with a slope of 53 mV/DpH and
2
a y intercept of 3.6 mV (correlation coefficient R = 0.99).
+
was Na -free [N-methyl-D-glucamine (NMDG )– times higher (4, 13). To determine if OTOP1 is sim- OTOP1 is a member of the otopetrin family of
+
based]. OTOP1 currents increased monotonically ilarly proton-selective, we evoked Otop1 currents proteins, which is evolutionarily conserved from
as pH o was lowered (Fig. 1, C to E) and the reversal by lowering pH o from 7.4 to 5.5 and measured nematodes to humans (12, 14)(Fig. 3A). We con- http://science.sciencemag.org/
+
potential (E rev ) shifted toward more positive volt- the effect of exchanging NMDG in the extra- firmed that human OTOP1 (hOTOP1) forms a chan-
ages (Fig. 1D and fig. S1A). The currents showed a cellular solution for equimolar concentrations of nel with properties similar to those of murine
+
+
+
small time-dependent change in amplitude in Na ,Cs ,orLi or isosmotic concentrations of OTOP1 (fig. S6). Murine OTOP2 and OTOP3 share
response to hyperpolarizing voltage steps, in- Ca 2+ (Fig. 2C). In all cases, the observed change 30 to 34% amino acid identity with murine OTOP1
dicating that gating of OTOP1 is mildly voltage- in current magnitude was less than 4%, indicat- (fig. S7). Each shows a distinctive pattern of ex-
sensitive (fig. S1, B and C). ing that OTOP1 is not appreciably permeable to pression. Otop1 is expressed in vestibular and taste
OTOP1 also generated an ionic current in HEK- theseions. SimilarexperimentsshowedthatOTOP1 cells,brownadiposetissue(15),heart, uterus, dorsal
+
293 cells (Fig.1,Fto H).AnN-terminalYFP (yellow is not appreciably permeable to K (fig. S3). To root ganglion, adrenal gland, mammary gland, and on March 1, 2018
fluorescent protein)–tagged protein confirmed the directly assess the selectivity of the channel for stimulated mast cells, whereas Otop2 expression
presence of OTOP1 at the cell surface (fig. S2A). protons, we measured the potential at which the is highest in stomach, testis, and olfactory bulb,
Lowering pH o elicited large inward currents in current reversed direction, the reversal potential and Otop3 is expressed in epidermis, small intes-
+
OTOP1-expressing cells and, as in oocytes, the (E rev ), as a function of the H gradient (DpH = tine, stomach, and retina [Fig. 3B; (16)]. When
current magnitude increased monotonically with pH i – pH o ). To study a predominantly OTOP1 expressed in Xenopus oocytes, OTOP2 and OTOP3
pH o (Fig. 1, F to H). OTOP1 currents in HEK-293 current, we applied Zn 2+ at a concentration that both generated large currents in response to lower-
+
cells decayed within seconds, with faster kinetics selectively and fully blocked the OTOP1 current in ing pH o in a Na -free solution. Compared with
2+
observed in response to more acidic stimuli (Fig. HEK-293 cells and focused on the Zn -sensitive OTOP1andOTOP3,OTOP2currentsbehavedanom-
1F). Thedecay of thecurrentsislikelytobedue,in component of the current (figs. S4 and S5, A and alously; currents saturated at ~pH 5, and E rev
+
part, to a reduction in the driving force as protons B). We limited H accumulation by setting pH i at shifted little over a range of pH 4 to 6 (Fig. 3, C
accumulate in the cytosol. For a 15-mm-diameter 6.0 and holding the membrane potential at E rev to E, and fig. S8A). OTOP2 currents measured in
+
cell (1767 fl volume), a H current of 1000 pA flow- (fig. S5A; see methods). Under these conditions, HEK-293 cells had similar properties (fig. S9).
ing for 1 s will increase the total (bound + free) E rev closely followed the Nernst prediction for an Like OTOP1, OTOP3 showed evidence of selectivity
+
+
+
intracellular concentration of H by ~6 mM (4). H -selective ion channel (Fig. 2, D and E). To for H ; the magnitude of OTOP3 currents increased
+
WeconfirmedthatOTOP1 mediatedflux of protons determine the selectivity of OTOP1 for H relative linearly as a function of pH o over the entire pH
–
+
into the cell cytosol with the membrane-permeant to Na and Cl ,we measured E rev upon replace- range tested (Fig. 3, F to H), and E rev shifted
+
+
+
pH indicator pHrodo Red. In Otop1-transfected ment of NMDG by Na and with high and low 46.3 mV/log[H ], close to the value of 58 mV/
–
+
cells, but not in mock-transfected cells, lowering concentrations of Cl in the extracellular solution. log[H ] expected for a proton-selective ion channel
extracellular pH from 7.4 to 5.0 caused a large In no case didweobserve anychangein E rev (fig. (fig. S8C). In response to hyperpolarizing voltage
increase in emission of pHrodo Red (Fig. 2, A and S5C). Assuming a change in E rev of less than 5 mV, steps,OTOP2andOTOP3currentsshowedevidence
B), corresponding to a large change in intracellular which would have been detectable, we used the ofmild(OTOP3)orno(OTOP2)voltagedependence
pH (fig. S2, B and C). Goldman-Hodgkin-Katz equation to calculate the (fig. S8, B and D). When expressed in HEK-293
+
+
Hv1 and M2 are highly selective for protons, selectivity of OTOP1 for H relative to Na at cells and assessed with microfluorimetry, both
–
5
+
present in high nanomolar concentrations, over greater than 2 × 10 –fold and H to Cl at greater OTOP2 and OTOP3 conducted protons into the
5
other cations whose concentrations are a million than 1 × 10 –fold (13). cell cytosol in response to lowering pH o (fig. S10),
Tu et al., Science 359, 1047–1050 (2018) 2 March 2018 2of4