
Page 123 - Science
P. 123
RESEARCH | REPORT
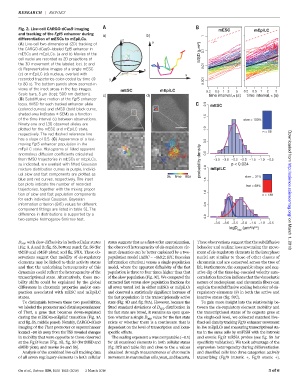
Fig. 2. Live-cell CARGO-dCas9 imaging mESC mEpiLC
and tracking of the Fgf5 enhancer during a) b) 1
differentiation of mESCs to mEpiLCs. z
(A) Live-cell two-dimensional (2D) tracking of y ~ 0.5
the CARGO-dCas9–labeled Fgf5 enhancer in 0.1
mESCs and mEpiLCs. (a and b) Movies of the 0.01 MSD (µm²)
cell nuclei are recorded as 2D projections of
the 3D movement of the labeled loci. (c and
d) Representative images of a single mESC x
(c) or mEpiLC (d) nucleus, overlaid with x
recorded trajectories color-coded by time (0 y 0.001
to 80 s). The bottom panels show zoomed-in
views of the inset areas in the top images. mESC mEpiLC 0.2 0.5 1 2 5 0.2 0.5 1 2 5
Scale bars, 5 mm (top); 500 nm (bottom). c) d) time interval, (s) time interval, (s)
(B) Subdiffusive motion of the Fgf5 enhancer
locus. tMSD for each tracked enhancer allele 2.0 mESC
(colored curves) and eMSD (bold black curve,
shaded area indicates ± SEM) as a function 1.5
of the time interval (t) between observations. slow = 100%
Ninety-one and 130 observed alleles are
plotted for the mESC and mEpiLC state, 1.0
n = 86
respectively. The red dashed reference line
has a slope of 0.5. (C) Appearance of a fast- 0.5
moving Fgf5 enhancer population in the
mEpiLC state. Histograms of fitted apparent Downloaded from
anomalous diffusion coefficients calculated 0.0
from tMSD trajectories in mESCs or mEpiLCs, probability density −3.5 −3.0 −2.5 −2.0 −1.5 −1.0 −0.5
as indicated, are overlaid with fitted Gaussian p < 0.024
mixture distribution curves in purple. Individ- 2.0 mEpiLC
ual slow and fast components are plotted as
0s time 80s slow = 31%
blue and red curves, respectively. The inset 1.5
bar plots indicate the number of recorded
fast = 69%
trajectories, together with the mixing propor- http://science.sciencemag.org/
tion of slow and fast population components 1.0 n = 138
for each individual Gaussian. Bayesian
information criterion (BIC) values for different 0.5
component fittings are listed in table S1. The
difference in distributions is supported by a 0.0
two-sample Kolmogorov-Smirnov test.
−3.5 −3.0 −2.5 −2.0 −1.5 −1.0 −0.5
logD (µm /s )
app on March 1, 2018
D app with slow diffusivity in both cellular states states suggests that as a first-order approximation, These observations suggest that the subdiffusive
[Fig. 3, A and B; fig. S5, bottom panel; fig. S6 (for the observed heterogeneity of cis-regulatory ele- behavior and scaling laws governing the move-
tMSD and eMSD plots); and fig. S7D]. These ob- ment dynamics can be better explained by a two- ment of cis-regulatory elements in the interphase
servations suggest that mobility of cis-regulatory population model [DBIC = −143.2; BIC, Bayesian nuclei are similar to those of other classes of
elements may be linked to their activity status information criterion] versus a single-population chromatin and are conserved across the tree of
and that the underlying heterogeneity of this model, where the apparent diffusivity of the fast life. Furthermore, the comparable shape and neg-
dynamics could reflect the heterogeneity of the population is three to four times higher than that ative dip of the time-lag–rescaled velocity auto-
transcriptional state. Alternatively, these mo- of the slow population (Fig. 3C). We compared the correlation function indicate that the viscoelastic
bility shifts could be explained by the global extracted fast versus slow population fractions for nature of nucleoplasm and chromatin fibers can
differences in chromatin properties and/or com- all seven tested loci in either mESCs or mEpiLCs explain the subdiffusive scaling behavior of cis-
paction associated with mESC and mEpiLC and observed a statistically significant increase of regulatory elements (8) in both the active and
states. the fast population in the transcriptionally active inactive states (fig. S7C).
To distinguish between these two possibilities, state (Fig. 3D and fig. S7A). However, because the To gain more insight into the relationship be-
we labeled the promoter and distal superenhancer fitted standard deviations of D app distribution in tween the cis-regulatory element mobility and
of Tbx3, a gene that becomes down-regulated the fast state are broad, it remains an open ques- the transcriptional status of its cognate gene at
during the mESC-to-mEpiLC transition (Fig. 3A tion whether a single D app valuefor thefaststate the single-cell level, we collected matched live–
and fig. S5, middle panel). Notably, CARGO-dCas9 exists or whether there is a continuum that is fixed cell data by tracking Fgf5 enhancer movement
imaging of the Tbx3 promoter or superenhancer dependent on the level of transcription and locus- in live mEpiLCs and measuring transcriptional sta-
located ~90 kb away from the TSS revealed changes specific effects. tus in the same cells by smFISH with the intronic
in mobility that were opposite to those observed The scaling exponent a was comparable (~0.5) and exonic Fgf5 mRNA probes (see fig. S8 for
at the Fgf5 locus [Fig. 3B, fig. S6 (for tMSD and for all examined elements in both cellular states specificity validation). We took advantage of the
eMSD plots), and movies S4 and S5]. (fig. S7B and table S2) and close to the a values expression heterogeneity during differentiation
Analysis of the combined live-cell tracking data obtained through measurements of chromatin and classified cells into three categories: actively
of all seven regulatory elements in both cellular movementin mammalian cells, yeast, and bacteria. transcribing (Fgf5 intronic +, Fgf5 exonic +),
Gu et al., Science 359, 1050–1055 (2018) 2 March 2018 3of 6