
Page 122 - Science
P. 122
RESEARCH | REPORT
whereas in the mEpiLC state the observed data We next used CARGO-dCas9 to label the Fgf5 thermore, an overall increase in mobility was
can be better explained by the appearance of an promoter, which is transcriptionally induced dur- observed for the Fgf5 promoter in the mEpiLC
additional “fast” population with a higher appar- ing the mESC-to-mEpiLC transition [Fig. 3A, fig. state, which can also be attributed to the ap-
ent anomalous diffusion coefficient D app (8.6 × S4 (for smFISH showing that labeling does not pearance of a fast subpopulation, with D app of
2
2
0.5
10 −3± 0.38 mm /s ) representing ~69% of the interfere with Fgf5 expression), and fig. S5, top 26 × 10 −3 ± 0.28 mm /s 0.5 (Fig. 3B, first row). Two
tracked enhancer alleles (with the remaining panel (for the CARGO array position in relation other promoters that become transcriptionally
alleles showing “slow” behavior with D app of to the transcription start site, TSS)]. Tracking induced during the mESC-to-mEpiLC transition,
2
0.5
1.6 × 10 −3± 0.16 mm /s ) (Fig. 2C). These mea- and MSD measurements of Fgf5 promoter move- Otx2 and Oct6, also show elevated mobility in
surements are consistent with the increased ment in mESCs showed a and D app values consist- the active state, whereas the Dusp5 promoter,
mobility of the enhancer in mEpiLCs in our ent with the slow subdiffusive behavior observed which maintains a consistently low transcrip-
time-lapse images. for the Fgf5 enhancer in mESCs (table S2). Fur- tional activity, shows unimodal distribution of
Construction of CARGO telomere Fgf5 enhancer
no gRNA repeat gRNA CARGO array
2nd half of 1st half of
n-th gRNA BpiI n+1-th gRNA
hybrid oligo:
BpiI
1 constant region
BpiI BpiI BpiI BpiI BpiI
BpiI BpiI BpiI BpiI BpiI
hybrid oligos Downloaded from
dCas9-eGFP Fgf5 locus FISH overlay
Ligate
2
BpiI BpiI BpiI BpiI BpiI
BpiI BpiI BpiI BpiI BpiI
minicircles http://science.sciencemag.org/
Cut with BpiI
3
labeling efficiency signal to background ratio
1.0 3.0
0.8 0 0.29 2.5
vector backbone 0.41
Ligate 0.6 2.0 on March 1, 2018
fraction number of nuclear puncta per cell 1 0.44 signal to background ratio in puncta
4 U6 promoter gRNA scaffold terminator 0.4 0.39
transcriptional unit 1.5
0.2 2 0.26
0.0 >2 0.19
vector backbone L1 L2 L1 L2
CARGO-dCas9-eGFP CARGO-dCas9-eGFP
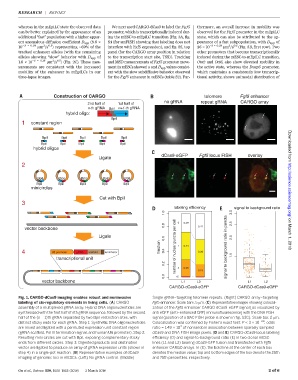
Fig. 1. CARGO-dCas9 imaging enables robust and noninvasive Single-gRNA–targeting telomere repeats. (Right) CARGO-array–targeting
labeling of cis-regulatory elements in living cells. (A) CARGO Fgf5 enhancer. Scale bars, 5 mm. (C) Representative images showing colocali-
assembly of a multiplexed gRNA array. Hybrid DNA oligonucleotides are zation of the Fgf5 enhancer CARGO dCas9-eGFP signal [as visualized by
synthesized with the first half of nth gRNA sequence, followed by the second anti-eGFP (anti–enhanced GFP) immunofluorescence] with the DNA FISH
half of the (n – 1)th gRNA separated by two BpiI restriction sites, with signal (position of a BAC FISH probe is shown in fig. S3C). Scale bar, 2 mm.
distinct sticky ends for each gRNA. Step 1: Synthetic DNA oligonucleotides Colocalization was confirmed by Fisher’s exact test: P <3 ×10 −28 ; odds
4
are mixed and ligated with a permuted expression unit constant region ratio = 1.49 × 10 of nonrandom association between sparsely sampled
(gRNA scaffold, Pol III termination signal, and human U6 promoter). Step 2: dCas9 and DNA FISH image pixels. (D and E) CARGO-dCas9 locus labeling
Resulting mini circles are cut with BpiI, exposing complementary sticky efficiency (D) and signal-to-background ratio (E) in two clonal mESC
ends from different circles. Step 3: Digested products and destination lines (L1 and L2) bearing dCas9-GFP fusion and transfected with Fgf5
vector are ligated to produce an array of gRNA expression units (shown in enhancer CARGO arrays. In (E), the bold line at the center of each box
step 4) in a single-pot reaction. (B) Representative examples of dCas9 denotes the median value; top and bottom edges of the box denote the 25th
imaging of genomic loci in mESCs. (Left) No gRNA control. (Middle) and 75th percentiles, respectively.
Gu et al., Science 359, 1050–1055 (2018) 2 March 2018 2of6