
Page 125 - Science
P. 125
RESEARCH | REPORT
n=53 n=90 n=26
Fgf5 inactive EpiLC ) -1.5
-1.0
logDapp (µm
Exonic /s
Intronic -2.0
Fgf5 active EpiLC -2.5 -3.0
Exonic p = 0.000014
Intronic smFISH intron: +
live locus single molecule smFISH exon: + +
tracking 0s time scale 60s RNA FISH
slow
DRB flavopiridol triptolide Downloaded from
10 0 10 0 10 0
eMSD(µm 2 ) 10 -1 10 -1 10 -1
10 -2
before DRB (n=53) 10 -2 before flavo (n=20) 10 -2 before triptolide (n=20)
15-30min after DRB (n=46) 30min after flavo (n=15) 10-15min after triptolide (n=16)
10 -3 10 -3 10 -3 http://science.sciencemag.org/
10 -1 10 0 10 1 10 -1 10 0 10 1 10 -1 10 0 10 1
transcriptional activation
time lag, τ(s) time lag, τ(s) time lag, τ(s)
fast
p<0.000002 p<0.06 p<0.05
0.03 0.03 0.04
k on promoter
n=36 n=13 0.03 n=15 enhancer
<D app > (µm 2 /s 0.5 ) 0.02 0.02 0.02 k on transcribing Pol II on March 1, 2018
chromatin organizing
proteins
0.01
0.01
0.00
0.00 0.00 0.01
before after before after before after
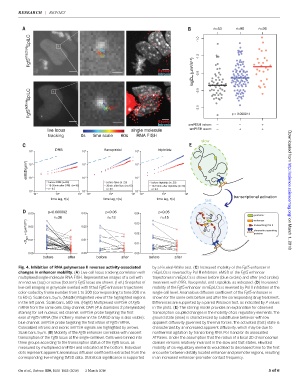
Fig. 4. Inhibition of RNA polymerase II reverses activity-associated by a Kruskal-Wallis test. (C) Increased mobility of the Fgf5 enhancer in
changes in enhancer mobility. (A) Live-cell locus tracking correlation with mEpiLCs is reversed by Pol II inhibition. eMSD of the Fgf5 enhancer
multiplexed single-molecule RNA FISH. Representative images of a cell with trajectories in mEpiLCs is shown before (blue circles) and after (red circles)
an inactive (top) or active (bottom) Fgf5 locus are shown. (Left) Snapshot of treatment with DRB, flavopiridol, and triptolide, as indicated. (D)Increased
live-cell imaging in grayscale overlaid with fitted Fgf5 enhancer trajectories mobility of the Fgf5 enhancer in mEpiLCs is reversed by Pol II inhibition at the
color-coded by frame number from 1 to 300 (corresponding to time 200 ms single-cell level. Anomalous diffusion coefficient of the Fgf5 enhancer is
to 60 s). Scale bars, 5 mm. (Middle) Magnified view of the highlighted regions shown for the same cells before and after the corresponding drug treatment.
in the left panel. Scale bars, 500 nm. (Right) Multiplexed smFISH of Fgf5 Differences are supported by a paired Wilcoxon test, as indicated by P values
mRNA from the same cells. Gray channel: DAPI (4′,6-diamidino-2-phenylindole) in the plots. (E) The stirring model provides an explanation for observed
staining for cell nucleus; red channel: smFISH probe targeting the first transcription-coupled changes in the mobility of cis-regulatory elements.The
exon of Fgf5 mRNA (the mCherry marker in the CARGO array is also visible); ground state (slow) is characterized by subdiffusive behavior with low
blue channel: smFISH probe targeting the first intron of Fgf5 mRNA. apparent diffusivity governed by thermal forces.The activated (fast) state is
Colocalized intronic and exonic smFISH signals are highlighted by arrows. characterized by an increased apparent diffusivity, which may be due to
Scale bars, 5 mm. (B) Mobility of the Fgf5 enhancer correlates with nascent nonthermal agitation by transcribing RNA Pol II and/or its associated
transcription of the Fgf5 locus at the single-cell level. Cells were binned into ATPases. Under the assumption that the radius of a local 3D chromosomal
three groups according to the transcription status of the Fgf5 locus, as domain remains relatively invariant in the slow and fast states, elevated
measured by multiplexed smFISH and indicated at the bottom. Individual mobility of cis-regulatory elements would lead to decreased time to the first
dots represent apparent anomalous diffusion coefficients extracted from the encounter between distally located enhancer and promoter regions, resulting
corresponding live-imaging tMSD data. Statistical significance is supported in an increased enhancer-promoter contact frequency.
Gu et al., Science 359, 1050–1055 (2018) 2 March 2018 5of6