
Page 129 - Science
P. 129
RESEARCH | REPORT
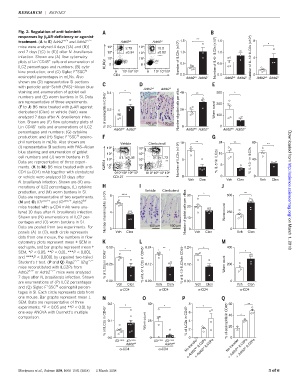
Fig. 2. Regulation of anti-helminth
responses by b 2 AR-deficiency or agonist **
treatment. (A to E) Adrb2 +/+ and Adrb2 −/− Adrb2 +/+ Adrb2 -/- 1.5 1.5 8 *
mice were analyzed 4 days [(A) and (B)] 10 5 2.75 10 5 10.5
and 7 days [(C) to (E)] after N. brasiliensis 10 4 ±0.34 10 4 ±0.83 1.0 1.0
infection. Shown are (A) flow cytometry 10 3 10 3 **** Number of ILC2s (×10 5 ) Number of IL-5 + ILC2s (×10 4 ) Number of IL-13 + ILC2s (×10 4 ) 4
–
+
plots of Lin CD45 cells and enumeration of KLRG1 0 0 0.5 0.5
ILC2 percentages and numbers; (B) cyto-
4
+
4
3
3
kine production; and (C) Siglec F SSC hi 0 10 10 10 5 0 10 10 10 5
CD4 0.0 0.0 0
eosinophil percentages in mLNs. Also Adrb2 +/+ Adrb2 -/- Adrb2 +/+ Adrb2 -/- Adrb2 +/+ Adrb2 -/-
shown are (D) representative SI sections
with periodic acid–Schiff (PAS)–Alcian blue
Adrb2 +/+ Adrb2 -/-
staining and enumeration of goblet cell 0.4 * 40 ** 300 *
numbers and (E) worm burdens in SI. Data
are representative of three experiments. 200
(F to J) B6 mice treated with b 2 AR agonist 20
clenbuterol (Clen) or vehicle (Veh) were % of eosinophils in CD45 + 0.2 Number of goblet cells per villus Worm count
analyzed 7 days after N. brasiliensis infec- 100
tion. Shown are (F) flow cytometry plots of 100 μm 100 μm
+
–
Lin CD45 cells and enumerations of ILC2 0.0 0 0
Adrb2 +/+ Adrb2 -/- Adrb2 +/+ Adrb2 -/- Adrb2 +/+ Adrb2 -/-
percentages and numbers; (G) cytokine
+
hi
production; and (H) Siglec F SSC eosino-
phil numbers in mLNs. Also shown are 10 ** 24 ** 80
Vehicle Clenbuterol **
(I) representative SI sections with PAS–Alcian 10 5 10 5 Downloaded from
blue staining and enumeration of goblet
10 4 10 4 16
cell numbers and (J) worm burdens in SI. 3 51.1±1.46 10 3 37.9±1.73 Number of ILC2s (×10 4 ) 5 40
Data are representative of three experi- KLRG1 10 ** % IL-5 + in ILC2s 8 % IL-13 + in ILC2s
ments. (K to M) B6 mice treated with anti- 10 0 2 10 0 2
CD4 (a-CD4) mAb together with clenbuterol 010 10 10 10 5 010 10 10 10 5
3
2
4
2
3
4
or vehicle were analyzed 10 days after CD127 0 0 0
Veh Clen Veh Clen Veh Clen
N. brasiliensis infection. Shown are (K) enu-
merations of ILC2 percentages, (L) cytokine
production, and (M) worm burdens in SI. **** Vehicle Clenbuterol * ** http://science.sciencemag.org/
Data are representative of two experiments. 8 30 500
(N and O) Il7r cre/+ and Il7r cre/+ Adrb2 f/f
mice treated with a-CD4 mAb were ana- 20
lyzed 10 days after N. brasiliensis infection. Number of eosinophils (×10 5 ) 4 Number of goblet cells per villus Worm count 250
Shown are (N) enumerations of ILC2 per- 10
centages and (O) worm burdens in SI.
Data are pooled from two experiments. For 0 100 μm 100 μm 0 0
panels (A) to (O), each circle represents Veh Clen Veh Clen Veh Clen on March 1, 2018
data from one mouse, the numbers in flow
cytometry plots represent mean ± SEM in
each gate, and bar graphs represent mean ± 0.50 * 0.24 ** 0.24 * 400
SEM. *P < 0.05, **P < 0.01, ***P < 0.001, *
and ****P < 0.0001 by unpaired two-tailed
Student’s t test. (P and Q) Rag2 −/− Il2rg −/− % of ILC2s in CD45 + 0.25 % of IL-5 + ILC2s in CD45 + 0.12 0.12 Worm count 200
mice reconstituted with ILC2Ps from % of IL-13 + ILC2s in CD45 +
Adrb2 +/+ or Adrb2 −/− mice were analyzed
7 days after N. brasiliensis infection. Shown
are enumerations of (P) ILC2 percentages 0.00 Veh Clen 0.00 Veh Clen 0.00 Veh Clen 0 Veh Clen
hi
+
and (Q) Siglec F SSC eosinophil percen-
α-CD4 α-CD4 α-CD4 α-CD4
tages in SI. Each circle represents data from
one mouse. Bar graphs represent mean ±
SEM. Data are representative of three
0.2 50 8 60 **
experiments. *P <0.05and **P <0.01 by * * *
% of ILC2s in CD45 + 0.1 Worm count 25 % of ILC2s in CD45 + 4 2 % of eosinophils in CD45 + 20
one-way ANOVA with Dunnett’s multiple 6 40 *
comparison.
0.0 0 0 0
+ Adrb2 -/- ILC2Ps
+ Adrb2 -/- ILC2Ps
Il7r Cre/+ Il7r Cre/+ Il7r Cre/+ Il7r Cre/+
Adrb2 f/f Adrb2 f/f No transfer No transfer
α-CD4 α-CD4 + Adrb2 +/+ ILC2Ps + Adrb2 +/+ ILC2Ps
Moriyama et al., Science 359, 1056–1061 (2018) 2 March 2018 3of 6