
Page 131 - Science
P. 131
RESEARCH | REPORT
significantly higher in Adrb2 −/− mice than in To examine whether b 2 AR-dependent inhibi- significantly higher levels of CellTrace Violet
Adrb2 +/+ mice (Fig. 4F). Together, these data tion of ILC2 proliferation is cell intrinsic, sorted intensity compared to vehicle-treated ILC2s,
indicate that b 2 AR signaling negatively regu- ILC2s were stained with a proliferation dye suggesting that the reduced proliferation after
lates ILC2 proliferation in vivo during type 2 (CellTrace Violet) and then cultured in vitro with b 2 AR agonist treatment occurs through a cell-
inflammation. a b 2 AR agonist. Agonist-treated ILC2s exhibited intrinsic mechanism (Fig. 4G). To further test this
Cell cycle
Cell cycle process
Id2
10 5 Nuclear division
Mitotic cell cycle process
Nitrogen compound metabolic process
Gata3
Mean normalized counts (agonist-treated, infected ) 10 3 Il4ra Crlf2 0.12 Nuclear chromosome segregation 0.0 NES 5.0
Mitotic cell cycle
Cellular nitrogen compound metabolic process
Rora
Il1rl1
Cell division
Chromosome segregation
2.5
Cell cycle
Enrichment score 0.08 NES = 4.85
1
10
FDR < 0.01
0.04
10 1 10 3 10 5 0.00
Mean normalized counts (infected)
Lower in Higher in Downloaded from
N. brasiliensis infection agonist-treated agonist-treated
10 5 10 5
50.4 41.1
10 4 10 4 H. polygyrus infection IL-33 i.p.
Vehicle 10 3 10 3 ** 80 * 5.0 * *
0 0
0 10 10 10 5 0 10 10 10 5 % of Ki67 + in ILC2s 60 % of Ki67 + in ILC2s 60 Number of ILC2s (×10 4 ) 2.5 % of Ki67 + in ILC2s 80
4
3
3
4
40
30
10 5 4 38.3 10 5 4 9.91 40 http://science.sciencemag.org/
Clenbuterol GATA-3 10 3 10 3 0 Vehicle 20 Vehicle 0.0 Vehicle 0 +/+ -/-
10
10
0
4
3
4
0 10 10 10 5 Ki67 0 0 10 10 10 5 Clenbuterol Clenbuterol Clenbuterol Adrb2 Adrb2
3
CD4 GATA-3
Adrb2 +/+ Adrb2 -/-
10 5 4 3 3.07 10 5 4 3 3.19 10 Steady state 5.0 N. brasiliensis on March 1, 2018
Steady state
10
10
Proliferation dye GMFI (×10 4 ) 1.5 10 0 2 5 4 0 10 2 10 3 10 4 10 5 10 0 2 5 4 0 10 2 10 3 10 4 10 5 % of ILC2s in Lin - (each genotype) 5 % ILC2s in Lin - (each genotype) 2.5
**
2.0
10
10
**
10
10
1.78
3.39
10
10
1.0
Vehicle Salmeterol N. brasiliensis KLRG1 10 0 3 2 10 0 3 2 0 Adrb2 +/+ Adrb2 -/- 0.0 Adrb2 +/+ Adrb2 -/-
10
10
0 10 2 10 3 10 4 10 5 0 10 2 10 3 10 4 10 5
CD127
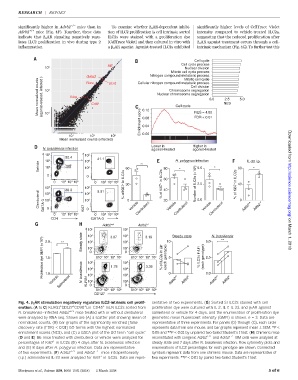
Fig. 4. b 2 AR stimulation negatively regulates ILC2-intrinsic cell prolif- sentative of two experiments. (G) Sorted SI ILC2s stained with cell-
+
+
+
+
–
eration. (A to C) KLRG1 CD127 CD90 Lin CD45 mLN ILC2s sorted from proliferation dye were cultured with IL-2, IL-7, IL-33, and b 2 AR agonist
N. brasiliensis–infected Adrb2 +/+ mice treated with or without clenbuterol salmeterol or vehicle for 4 days, and the enumeration of proliferation dye
were analyzed by RNA-seq. Shown are (A) a scatter plot showing mean of geometric mean fluorescent intensity (GMFI) is shown. n = 3. Data are
normalized counts, (B) bar graphs of the significantly enriched [false representative of three experiments. For panels (D) through (G), each circle
discovery rate (FDR) < 0.01] GO terms with the highest normalized represents data from one mouse, and bar graphs represent mean ± SEM; *P <
enrichment scores (NES), and (C) a GSEA plot of the GO term “cell cycle.” 0.05 and **P <0.01by unpairedtwo-tailedStudent’s t test. (H)Chimericmice
(D and E) B6 mice treated with clenbuterol or vehicle were analyzed for reconstituted with congenic Adrb2 +/+ and Adrb2 −/− BM cells were analyzed at
+
percentages of Ki67 in ILC2s (D) 4 days after N. brasiliensis infection steady state and 7 days after N. brasiliensis infection. Flow cytometry plots and
and (E) 8 days after H. polygyrus infection. Data are representative enumerations of ILC2 percentages for each genotype are shown. Connected
of two experiments. (F) Adrb2 +/+ and Adrb2 −/− mice intraperitoneally symbols represent data from one chimeric mouse. Data are representative of
+
(i.p.) administered IL-33 were analyzed for Ki67 in ILC2s. Data are repre- two experiments. **P <0.01bypairedtwo-tailedStudent’s t test.
Moriyama et al., Science 359, 1056–1061 (2018) 2 March 2018 5of6