
Page 128 - Science
P. 128
RESEARCH | REPORT
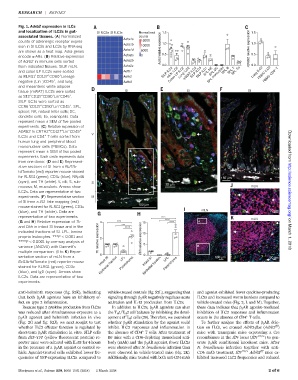
Fig. 1. Adrb2 expression in ILCs
and localization of ILC2s in gut- SI ILC2s SI ILC3s Normalized 1.5 1.5
associated tissues. (A) Normalized counts
Adra1a
counts of adrenergic receptor expres- 15000
Adra1b 1.0 1.0
sion in SI ILC2s and ILC3s by RNA-seq 10000
Adra1d Adrb2 relative expression ADRB2 relative expression
are shown as a heat map. Adra genes 5000 0.5 0.5
encode a-ARs. (B) Relative expression Adra2a 0
of Adrb2 in immune cells sorted Adra2b
from indicated tissues. SILP, mLN, Adra2c 0.0 0.0
PBMC ILC2
mWAT ILC2
mLN ILC2
SILP ILC1
and colon LP ILC2s were sorted Adrb1 SILP ILC2 Lung ILC2 SILP ILC3 SPL NK SPL DC SPL B SPL T SPL Eo Lung ILC2
+
+
+
as KLRG1 CD127 CD90 Lineage Adrb2 Colon LP ILC2 SPL monocytes PBMC CD4 + T
–
+
negative (Lin )CD45 , and lung Adrb3
and mesenteric white adipose
tissue (mWAT) ILC2s were sorted SI SI SI
–
+
+
+
+
as ST2 CD127 CD90 Lin CD45 .
SILP ILC3s were sorted as
+
+
–
+
+
CCR6 CD127 CD90 Lin CD45 . SPL,
spleen; NK, natural killer cells; DC,
dendritic cells; Eo, eosinophils. Data
represent mean ± SEM of five pooled
experiments. (C) Relative expression of
–
+
+
ADRB2 in CRTH2 CD127 Lin CD45 + V
+
ILC2s and CD4 T cells sorted from
human lung and peripheral blood
mononuclear cells (PBMCs). Data Downloaded from
represent mean ± SEM of two pooled E
experiments. Each circle represents data
from one donor. (D and E) Represent-
ative sections of SI from a Bcl11b-
tdTomato (red) reporter mouse stained
for KLRG1 (green), CD3e (blue), NKp46 150 μm
(cyan), and TH (white). V, villi; S, sub- S 20 μm
mucosa; M, muscularis. Arrows show mLN
ILC2s. Data are representative of two http://science.sciencemag.org/
experiments. (F) Representative section M
of SI from a Il13–fate mapping (red)
mouse stained for KLRG1 (green), CD3e 100 μm
(blue), and TH (white). Data are mLN 20 μm
representative of two experiments. **** mLN
(G and H) Relative expression of Th 4 *** 15 **** **** J
and Dbh in intact SI tissue and in the *** ****
indicated fractions of SI. LPL, lamina 10 on March 1, 2018
propria leukocytes. ***P < 0.001 and Th relative expression 2 Dbh relative expression
****P < 0.0001 by one-way analysis of 5
variance (ANOVA) with Dunnett’s K
multiple comparison. (I to K) Repre-
sentative section of mLN from a 0 20 μm 0 20 μm 100 μm 20 μm
LPL
LPL
Bcl11b-tdTomato (red) reporter mouse Intact SI Parenchyma Intact SI Parenchyma
stained for KLRG1 (green), CD3e Epithelial fraction Epithelial fraction
(blue), and IgD (cyan). Arrows show
ILC2s. Data are representative of two
experiments.
anti-helminth responses (fig. S2K), indicating vehicle-treated controls (fig. S2L), suggesting that and agonist exhibited fewer cytokine-producing
that both b 2 AR agonists have an inhibitory ef- signaling through b 2 AR negatively regulates acute ILC2s and increased worm burdens compared to
fect on type 2 inflammation. activation and IL-13 production from ILC2s. vehicle-treated mice (Fig. 2, L and M). Together,
Because type 2 cytokine production from ILC2s In addition to ILC2s, b 2 AR agonists can alter thesedataindicatethat b 2 AR agonist–mediated
was reduced after simultaneous exposure to a the T H 1/T H 2 cell balance by inhibiting the devel- inhibition of ILC2 responses and inflammation
+
b 2 AR agonist and helminth infection in vivo opment of T H 1cells (28). Therefore, we examined occurs in the absence of CD4 T cells.
(Fig. 2G and fig. S2J), we next sought to test whether b 2 AR stimulation by the agonist could To further analyze the effects of b 2 AR dele-
f/f
whether ILC2 effector function is regulated by inhibit ILC2 responses and inflammation in tion on ILCs, we crossed Adrb2-flox (Adrb2 )
+
short-term b 2 AR stimulation in vitro. SILP cells the absence of CD4 T cells. After treatment of mice with transgenic mice expressing a Cre
from Il13–YFP (yellow fluorescent protein) re- B6 mice with a CD4–depleting monoclonal anti- recombinase in the Il7r locus (Il7r cre/+ ) to gen-
porter mice were cultured with IL-33 for 4 hours body (mAb) and the b 2 AR agonist, fewer ILC2s erate b 2 AR conditional knockout mice. After
in the presence of a b 2 AR agonist or control ve- were observed after N. brasiliensis infection than N. brasiliensis infection together with anti-
hicle. Agonist-treated cells exhibited lower fre- were observed in vehicle-treated mice (Fig. 2K). CD4 mAb treatment, Il7r cre/+ Adrb2 f/f mice ex-
quencies of YFP-expressing ILC2s compared to Additionally, mice treated with both anti-CD4 mAb hibited increased ILC2 frequencies and reduced
Moriyama et al., Science 359, 1056–1061 (2018) 2 March 2018 2of6