
Page 124 - Science
P. 124
RESEARCH | REPORT
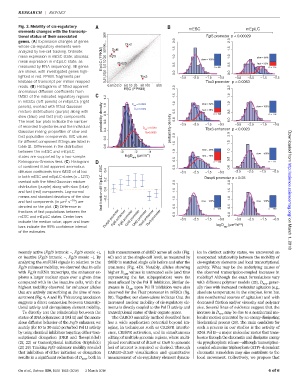
Fig. 3. Mobility of cis-regulatory mESC mEpiLC
elements changes with the transcrip-
tional status of their associated 500 Fgf5 promoter p < 0.00029
genes. (A) Expression changes of genes 2.0 2.0
whose cis-regulatory elements were 50 100 Otx2 1.5 1.5
analyzed by live-cell tracking. Ordinate: Oct6
mean expression in mESC state; abscissa: EpiLC (FPKM) 20 Fgf5 1.0 1.0 slow = 68%
mean expression in mEpiLC state, as 5.0 10 Dusp5 slow = 100% fast = 32%
measured by RNA sequencing. All genes 0.5 n = 90 0.5 n = 115
are shown, with investigated genes high- 0.0 0.0
lighted in red. FPKM, fragments per 0.51.02.0 Tbx3 −3.5 −2.5 −1.5 −0.5 −3.5 −2.5 −1.5 −0.5
kilobase of transcript per million mapped Tbx3 promoter p < 0.0083
reads. (B) Histograms of fitted apparent 0.51.0 2.0 5.0 10 20 50 100 500 2.0 2.0
ESC (FPKM)
anomalous diffusion coefficients from
tMSD of the indicated regulatory regions 1.2 1.5 1.5
in mESCs (left panels) or mEpiLCs (right 1.0 1.0
panels), overlaid with fitted Gaussian 1.0 D app = 0.0023 slow = 62% slow = 100%
^ 1 = 0.0009
mixture distributions (purple) along with 0.8 0.5 fast = 38% 0.5
slow (blue) and fast (red) components. probability density n = 190 n = 118
The inset bar plots indicate the number 0.6 0.0 0.0
of recorded trajectories and the individual D app = 0.0087 probability density −3.5 −2.5 −1.5 −0.5 −3.5 −2.5 −1.5 −0.5
Tbx3 enhancer p < 0.0023
Gaussian mixing proportion of slow and 0.4 ^ 2 =0.0065
fast population components. BIC values 0.2 2.0 2.0
for different component fittings are listed in 1.5 1.5
table S1. Differences in the distribution 0.0 0 Downloaded from
between the mESC and mEpiLC -3 -2 -1 1.0 slow = 28% 1.0 slow = 100%
states are supported by a two-sample logD (µm /s ) fast = 72% 0.5
app
Kolmogorov-Smirnov test. (C) Histogram 0.5 n = 143 n = 111
of combined fitted apparent anomalous 0.0 0.0
diffusion coefficients from tMSD of all loci 0.4 −3.5 −2.5 −1.5 −0.5 −3.5 −2.5 −1.5 −0.5
in both mESC and mEpiLC states (n =1271) Dusp5 promoter p < 0.25
overlaid with the fitted Gaussian mixture 0.2 2.0 2.0
distribution (purple) along with slow (blue) fast fraction diff EpiLC−ESC 0.0
and fast (red) components. Log-normal 1.5 1.5 http://science.sciencemag.org/
means and standard deviations of the slow −0.2 1.0 1.0
2
and fast components (in mm s −0.5 )are slow = 100% slow = 100%
denoted on the plot. (D)Differencein 0.5 n = 168 0.5 n = 190
Tbx3 enhancer
Oct6 promoter
Fgf5 enhancer
fractions of fast populations between the 0.0 0.0
mESC and mEpiLC states. Center bars Dusp5 promoter Fgf5 promoter Otx2 promoter Tbx3 promoter −3.5 −2.5 −1.5 −0.5 −3.5 −2.5 −1.5 −0.5
indicate the median value; upper and lower 2 0.5
bars indicate the 95% confidence interval logD app (µm /s )
of the estimates. on March 1, 2018
recently active (Fgf5 intronic −, Fgf5 exonic +), bulk measurements of eMSD across all cells (Fig. ics in distinct activity states, we uncovered an
or inactive (Fgf5 intronic −, Fgf5 exonic −). By 4C) and at the single-cell level, as measured by unexpected relationship between the mobility of
analyzing the smFISH signals in relation to the tMSD in matched single cells before and after the cis-regulatory elements and local transcriptional
Fgf5 enhancer mobility, we observed that in cells treatment (Fig. 4D). Notably, alleles showing activity. What may be the underlying causes of
with Fgf5 mRNA transcripts, the enhancer ex- higher D app values in untreated cells (and thus the observed transcription-coupled increases in
plores a larger nuclear space over a given time representing the fast subpopulation) were the mobility? Although the exact formulations vary
compared with in the inactive cells, with the most affected by the Pol II inhibition. Similar de- with different polymer models (25), D app gener-
highest mobility observed for enhancer alleles creases in D app upon Pol II inhibition were also ally rises with increased molecular agitation (e.g.,
that are actively transcribing at the time of mea- observed for the Tbx3 promoter in mESCs (fig. absolute temperature in the simplest form but
surement (Fig. 4, A and B). This strong association S9). Together, our observations indicate that the also nonthermal sources of agitation) and with
suggests a direct connection between transcrip- increased nuclear mobility of cis-regulatory ele- decreased friction and/or viscosity and polymer
tional activity and cis-regulatory element mobility. ments is directly coupled to the Pol II activity and size. Several lines of evidence suggest that the
To directly test the relationship between the transcriptional status of their cognate genes. increase in D app maybedue to anonthermalmo-
status of RNA polymerase II (Pol II) and the anom- The CARGO assembly method described here lecular motion generated by an energy-dissipating
alous diffusive behavior of the Fgf5 enhancer, we has a wide application potential beyond im- biochemical process (26). The main candidate for
acutely (for 10 to 30 min) perturbed Pol II activity aging, in techniques such as CRISPR interfer- such a process in our studies is the activity of
by using chemical inhibitors targeting either tran- ence, CRISPR activation, and in simultaneous RNA Pol II—a major molecular motor that trans-
scriptional elongation (DRB and flavopiridol) editing of multiple genomic regions, where multi- locates through the chromatin and dissipates energy
(21, 22)ortranscriptional initiation (triptolide) plexed recruitment of dCas9 or Cas9 to genomic via pyrophosphate release—although transcription-
(23, 24). Tracking Fgf5 enhancer mobility revealed loci of interest is required or desired. Through coupled adenosine triphosphate (ATP)–dependent
that inhibition of either initiation or elongation CARGO-dCas9 visualization and quantitative chromatin remodelers may also contribute to the
results in a significant reduction of D app ,bothin measurement of cis-regulatory element dynam- local movement. Collectively, we propose that
Gu et al., Science 359, 1050–1055 (2018) 2 March 2018 4of6