Page 104 - VIRANSH COACHING CLASSES
P. 104

5)  Oceanic trade : Most of India’s trade            these  ports were overburdened.  Recently,
                 is by sea. India has trade relations with         India has developed new ports at Kandla,
                 its neighbouring countries like Nepal,            Cochin, Vishakhapatnam, Nhava Sheva etc.
                 Afghanistan, Myanmar, Sri Lanka etc. The          to reduce the burden on the exsiting ports.
                 share of India’s oceanic trade is around 68%.
                                                                Find out :
              6)  Development of new ports : For its foreign
                 trade, India depended mostly on Mumbai,          Recent share of India’s foreign trade in
                 Kolkata and Chennai ports. Therefore,          Gross National Income.


               Do you know?

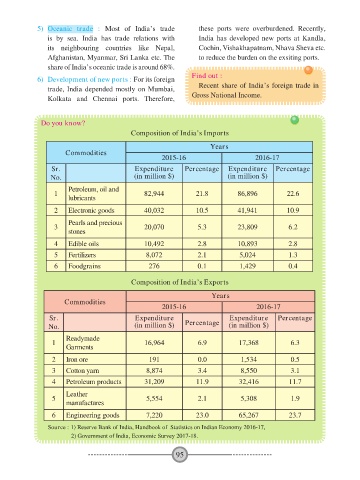
                                            Composition of India’s Imports
                                                                       Years
                       Commodities
                                                       2015-16                       2016-17
                  Sr.                         Expenditure     Percentage     Expenditure  Percentage
                  No.                        (in million $)                 (in million $)
                        Petroleum, oil and
                   1                             82,944           21.8          86,896          22.6
                        lubricants

                   2    Electronic goods         40,032           10.5          41,941          10.9
                        Pearls and precious
                   3                             20,070           5.3           23,809          6.2
                        stones

                   4    Edible oils              10,492           2.8           10,893          2.8
                   5    Fertilizers              8,072            2.1           5,024           1.3
                   6    Foodgrains                276             0.1           1,429           0.4

                                            Composition of India’s Exports

                                                                       Years
                      Commodities
                                                       2015-16                        2016-17
                 Sr.                          Expenditure                    Expenditure     Percentage
                 No.                         (in million $)   Percentage     (in million $)
                       Readymade
                  1                              16,964           6.9           17,368           6.3
                       Garments
                  2    Iron ore                   191             0.0            1,534           0.5

                  3    Cotton yarn               8,874            3.4            8,550           3.1
                  4    Petroleum products        31,209           11.9          32,416           11.7

                       Leather
                  5                              5,554            2.1            5,308           1.9
                       manufactures
                  6    Engineering goods         7,220            23.0          65,267           23.7

                 Source : 1) Reserve Bank of India, Handbook of  Statistics on Indian Economy 2016-17,
                          2) Government of India, Economic Survey 2017-18.


                                                           95
   99   100   101   102   103   104   105   106   107   108   109