
Page 106 - [Uma_Sekaran]_Research_methods_for_business__a_sk(BookZZ.org)
P. 106
90 THE RESEARCH PROCESS
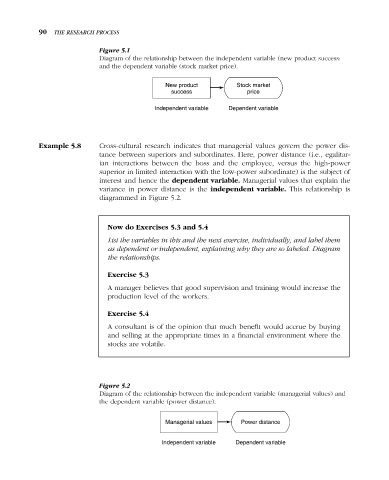
Figure 5.1
Diagram of the relationship between the independent variable (new product success:
and the dependent variable (stock market price).
New product Stock market
success price
Independent variable Dependent variable
Example 5.8 Cross-cultural research indicates that managerial values govern the power dis-
tance between superiors and subordinates. Here, power distance (i.e., egalitar-
ian interactions between the boss and the employee, versus the high-power
superior in limited interaction with the low-power subordinate) is the subject of
interest and hence the dependent variable. Managerial values that explain the
variance in power distance is the independent variable. This relationship is
diagrammed in Figure 5.2.
Now do Exercises 5.3 and 5.4
List the variables in this and the next exercise, individually, and label them
as dependent or independent, explaining why they are so labeled. Diagram
the relationships.
Exercise 5.3
A manager believes that good supervision and training would increase the
production level of the workers.
Exercise 5.4
A consultant is of the opinion that much benefit would accrue by buying
and selling at the appropriate times in a financial environment where the
stocks are volatile.
Figure 5.2
Diagram of the relationship between the independent variable (managerial values) and
the dependent variable (power distance).
Managerial values Power distance
Independent variable Dependent variable